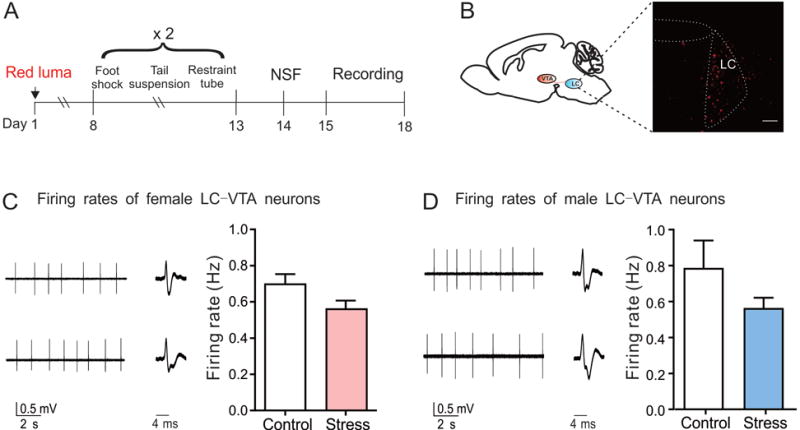
Fig. 3.

LC-VTA circuit neurons in female and male mice display firing rates comparable to that of their control mice after SCVS. (A) Experimental timeline. (B) Red lumafluor-labeled LC-VTA circuit neurons (scale bar=100 μm). (C) Sample traces and statistical data of neuronal activity of LC-VTA circuit neurons in female mice following SCVS (t10=1.11, P=0.30, n=6 mice/group). (D) Sample traces and statistical data of neuronal activity of LC-VTA circuit neurons in male mice following SCVS (t10=1.30, P=0.22, n=6 mice/group).
