Fig. 1.
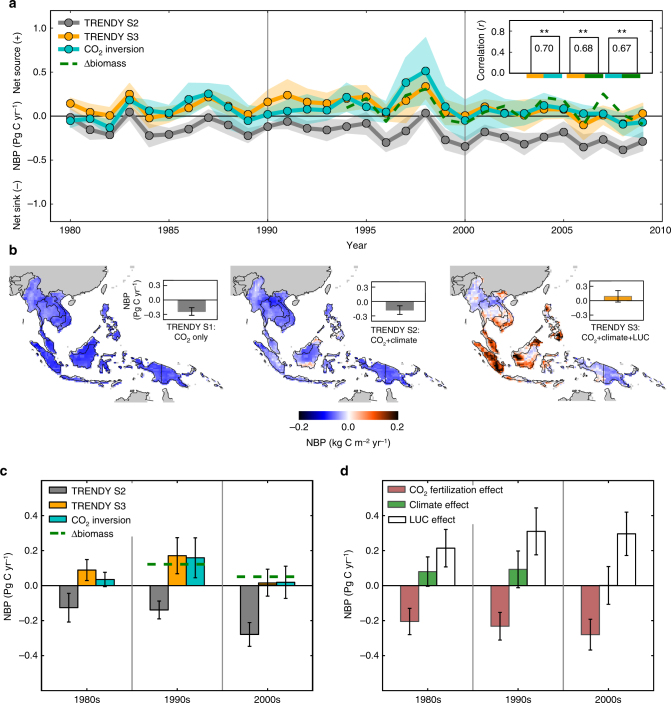
Interannual and decadal variability of net CO2 flux in Southeast Asia for 1980–2009. a Interannual variability of ensemble averaged NBP from the TRENDY (grey: TRENDY S2; orange: TRENDY S3) and atmospheric CO2 inversions (cyan) for the period 1980–2009, and annual biomass change (dashed green line: Δbiomass) for the period 1994–2009. Shading for the TRENDY and atmospheric CO2 inversions represents 1σ variation among models. A top-right panel shows correlation coefficients (r) between interannual variability of the three NBP estimates for the overlapping periods (1980–2009 for the TRENDY and atmospheric CO2 inversions; 1994–2009 for the TRENDY and Δbiomass, and for the atmospheric CO2 inversions and Δbiomass) and statistical significance is indicated by **p < 0.01. Negative values in NBP represent a net sink, and positive values a net source. b Spatial variability of mean annual NBP from the TRENDY (seven model ensemble average) for the period 1980–2009. Results are shown for the three simulations: forced with varying CO2 only (left: TRENDY S1); varying CO2 and climate (middle: TRENDY S2); and varying CO2, climate and LUC (right: TRENDY S3). Bar graphs represent mean annual NBP by the TRENDY simulations (grey: TRENDY S1 and S2; orange: TRENDY S3) for the period 1980–2009 with error bars representing 1σ variation among models. c Decadal NBP budgets from the TRENDY (grey: TRENDY S2; orange: TRENDY S3) and atmospheric CO2 inversions (cyan) for the 1980s, 1990s and 2000s, with error bars representing 1σ variation among models. Decadal budgets from annual biomass changes are shown with dashed horizontal lines for the 1990s (1994–1999) and 2000s (2000–2009). d Decadal variability of the attributing factors to NBP from the TRENDY (crimson: the CO2 fertilization effect, green: the climate effect and white: the LUC effect) with error bars representing 1σ variation among models

