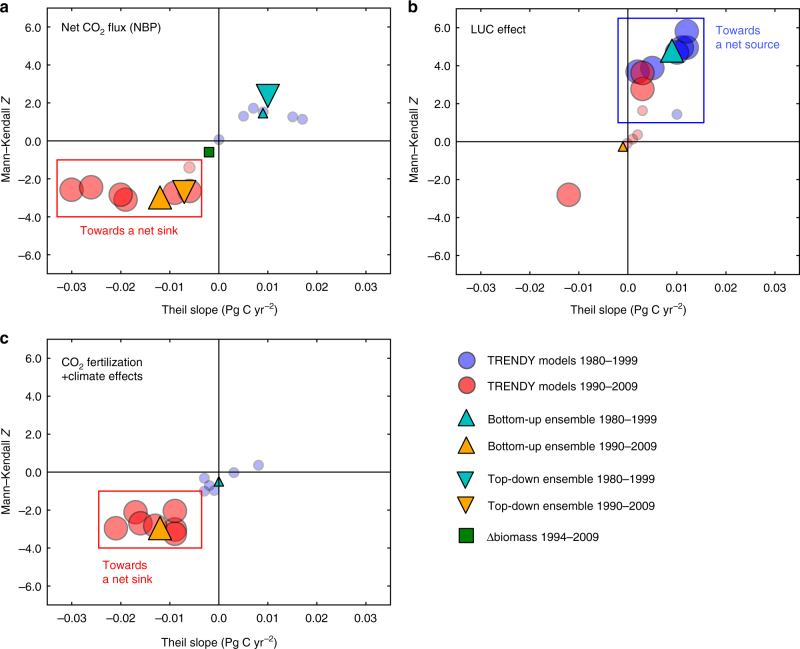
Fig. 2.
Trends in net CO2 flux and its components for the past 30 years. Results of two trend tests (Mann–Kendall and Theil slope tests) on a, net CO2 flux (NBP) from the TRENDY S3 (seven models: blue circles for 1980–1999 and red circles for 1990–2009, and ensemble average: a cyan upper triangle for 1980–1999 and an orange upper triangle for 1990–2009) are shown along with those on the atmospheric CO2 inversions (ensemble average: a cyan lower triangle for 1980−1999 and an orange lower triangle for 1990–2009) and Δbiomass (a green square for 1994−2009). The trend tests on attributing factors to NBP are illustrated for b, the LUC effect and c, CO2 fertilization+climate effects. Size of markers indicates statistical significance of trends: larger (p < 0.05) and smaller (p ≥ 0.05)

