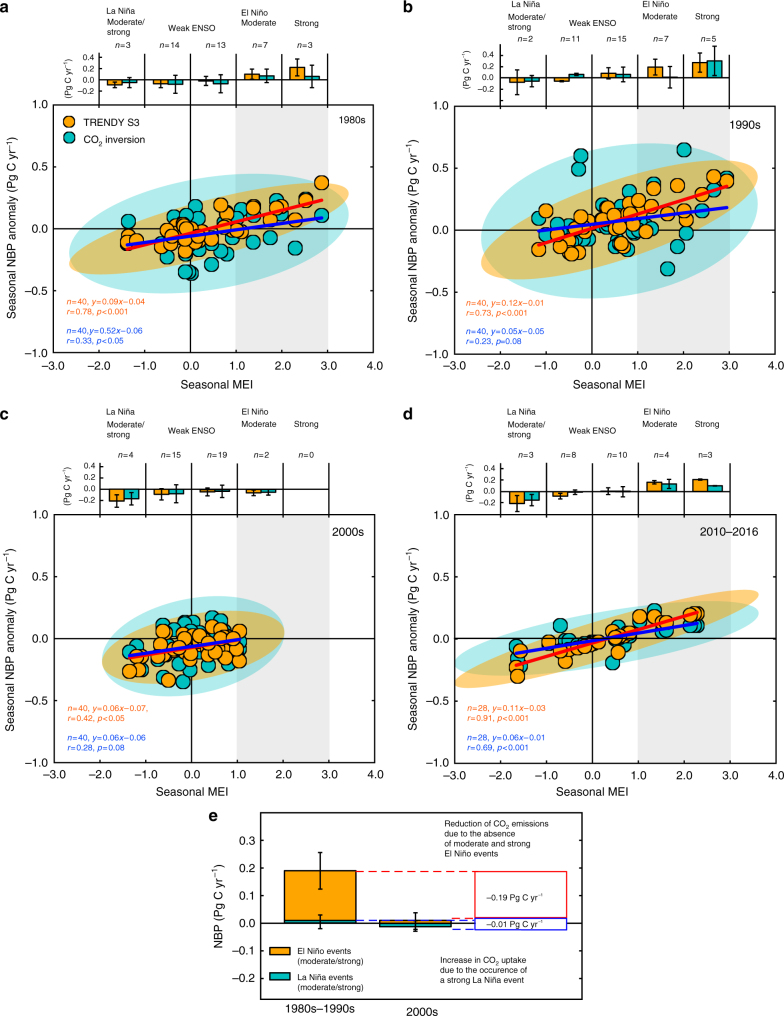
Fig. 6.
Decadal patterns of relationships between El Niño-Southern Oscillation and net CO2 flux anomaly. Relationship between seasonal MEI and NBP anomaly from the TRENDY S3 (orange) and atmospheric CO2 inversions (cyan) for a the 1980s, b 1990s, c 2000s and d current period (2010–2016). MEI and NBP anomaly are 3-month averaged (i.e. JFM, AMJ, JAS and OND), and their relationships are constructed in such a way that MEI leads the NBP anomaly by 3 months to account for the observed lag of influence by El Niño on CO2 fluxes (see Methods). Along with scatter plots, 95% confident ellipses and regression lines are shown for the TRENDY S3 and atmospheric CO2 inversions. Grey shading represents ranges of large positive MEI values and positive NBP anomalies. Bar graphs on the top of the scatter plots are seasonal NBP anomaly averaged for different strengths of ENSO; MEI < −1 (moderate and strong La Niña), MEI = −1 to 1 (weak ENSO events), MEI = 1 to 2 (moderate El Niño), and MEI > 2 (strong El Niño). Error bars represent 1σ variation of data within different strengths of ENSO. e Budgets of NBP by the TRENDY S3 corresponding to moderate/strong La Niña and El Niño events in the decades of 1980s–1990s and 2000s. Error bars represent 1σ variation among models

