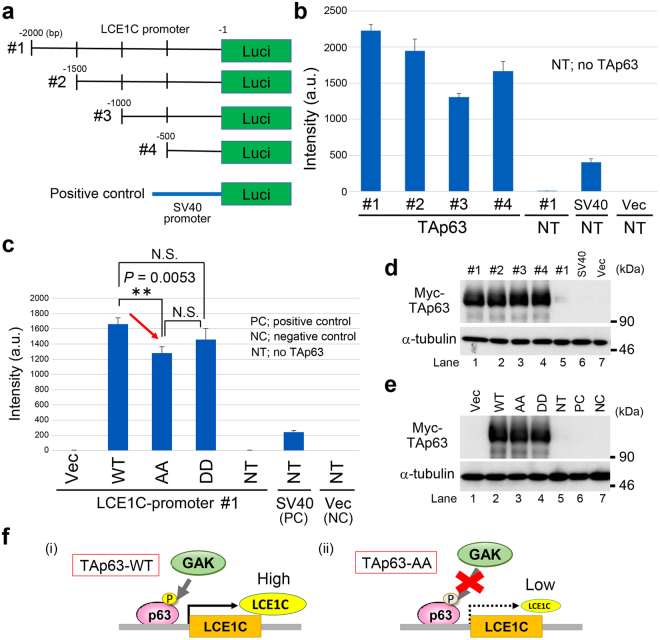
Figure 3.
Luciferase reporter assays using the promoter region of the LCE1C gene. (a) A schematic representation of the promoter region (~2000 bp) of LCE1C. Green box indicates the location of the luciferase gene. (b) Bar graph to indicate the promoter activity of #1–4 promoter regions (arbitrary units). Promoter activity of SV40 promoter was measured as a positive control. Promoter activities using no TAp63 DNA (NT) or vector alone (Vec) in the reaction mixture were also measured as negative controls. (c) Bar graph to examine the alteration of the promoter activity of LCE1C-promoter #1 by addition of Myc-TAp63-WT, Myc-TAp63-T46A/T281A (AA), or Myc-TAp63-T46D/T281D (DD) plasmids into the reaction mixture. Promoter activities using no TAp63 DNA (NT) or vector alone (Vec) in the reaction mixture were also measured as negative controls (NC). Addition of SV40 promoter was examined as a positive control (PC). N.S. indicates no significant difference. (d,e) Wb to confirm the exogenous expression of Myc-TAp63 in luciferase assays. α-tubulin was detected as a loading control. (f) A schematic representation of the action of the GAK_TAp63-T46/T281_LCE1C axis (i), which was destroyed in the Myc-TAp63-T46A/T281A (AA) expressing cells (ii).

