Figure 2.
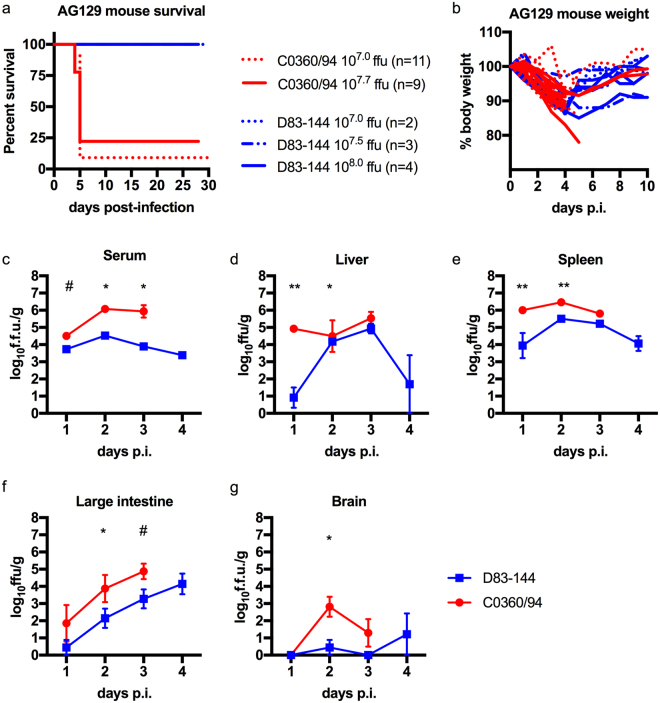
Comparison of DENV-3 disease in adult AG129 mice. (a) Kaplan-Meier survival curves of mice infected with 107.0 (n = 11) or 107.7 (n = 9) f.f.u. of C0360/94 or 107.0 (n = 2), 107.5 (n = 3), or 108.0 (n = 4) f.f.u. of D83-144 via the i.p. route. Mice were monitored for at least 4 weeks. (b) Percent weight lost during infection relative to animal weight prior to infection, each line represents the time course of a single animal. (c–g) Mice inoculated with 107.5 f.f.u. D83-144 or C0360/94 were sacrificed daily to determine viral loads during acute infection. (c) Blood was collected and serum samples were used for viremia measurement; results are from three independent experiments. Differences in daily viral titers between D83-144 and C0360/94 were determined by Mann-Whitney tests and asterisks denote significance; day 2 p = 0.0003, day 3 p = 0.0011, day 1 was not significant, p = 0.0545 (denoted by #). (d–g) Internal organ samples were homogenized, and virus was titrated; results are pooled from two separate experiments. (d) Liver viral titers were significantly different on day 1 (p = 0.0030) and day 2 (p = 0.0466). (e) Spleen viral titers were significant on day 1 (p = 0.0061) and day 2 (p = 0.0012). (f) Viral titers in the large intestine were significant on day 2 only (p = 0.0344) and trended significant on day 3, p = 0.0669 (denoted by #). Viral titers in the brain were low for both D83-144 and C0360/94, but were significantly different on day 2 (p = 0.0128). Serum titers are expressed as log10 f.f.u./ml and organ titers as log10 f.f.u./g of tissue. Symbols represent mean sample titers, error bars: SEM. L.O.D. as follow: serum: 102.0 f.f.u.; liver: 102.8 f.f.u.; spleen: 102.8 f.f.u.; large intestine: 103.0 f.f.u.; brain: 102.7 f.f.u.

