
Figure 4.
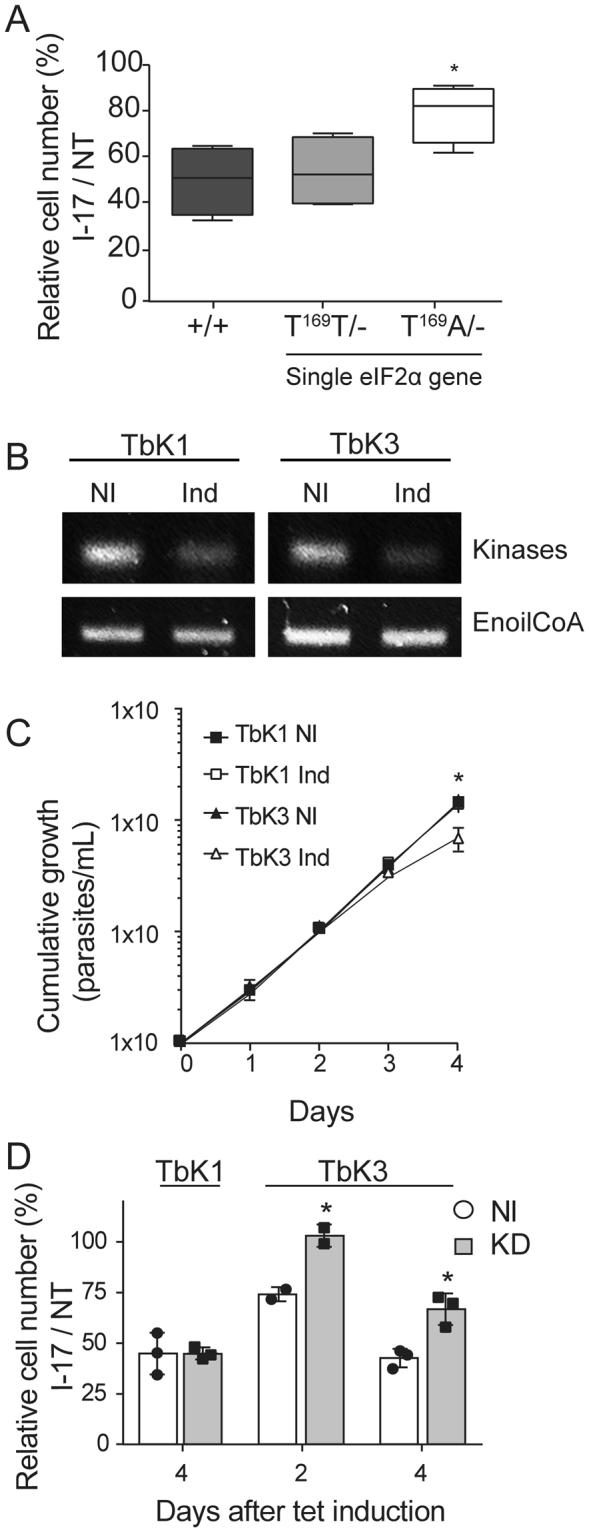
I-17 inhibition depends on phosphorylatable eIF2α and a specific eIF2α kinase. (A) Relative cell numbers after 24 hours were measured in percentages by dividing the total number of T. brucei BSF treated with 5 µM of I-17 by the cell number of the appointed lineages maintained without I-17 (NT). (+/+) corresponds to a parental BSF line, (T169T/−) to BSF containing a single wild type eIF2α gene, and (T169A/−) to BSF containing one alelle of eIF2α gene mutated for alanine at T169. The boxes are means ± min and max values of quadruplicate experiments. *Indicates p < 0.05 calculated using the Student’s t-test. (B) RT-PCR of total RNA extracted from PCF stably transfected using p2T7-177 with segments of TbK1 and TbK3 kinases after four days without (NI) or with tetracycline-induction for RNAi expression (Ind). The top panels show a PCR using primers for TbK1 and TbK3, and the bottom panels using primers for the enoyl-CoA as an expression control. The original gels are shown in the Supplementary Figure 3. (C) Cumulative growth curve of TbK1 (squares) and TbK3 (triangles) PCF lineages without (NI) or with tetracycline (Ind) for RNAi induction. The values in (C) are means ± standard deviation of triplicate and independent experiments. (D) Relative cell numbers in percentages measured as the ratio of total cell numbers of cultures treated with 3 µM I-17 and non-treated cultures (NT), using both TbK1 and TbK3 lineages non-induced with tetracycline (NI, empty bars) or after RNAi induction (Ind, grey bars). I-17 treatment was maintained for 48 hours and initiated 2 or 4 days after tetracycline addition. The values in (D) are means ± standard deviation of triplicate and independent experiments. *Indicates p < 0.05 calculated using the Student’s t-test.