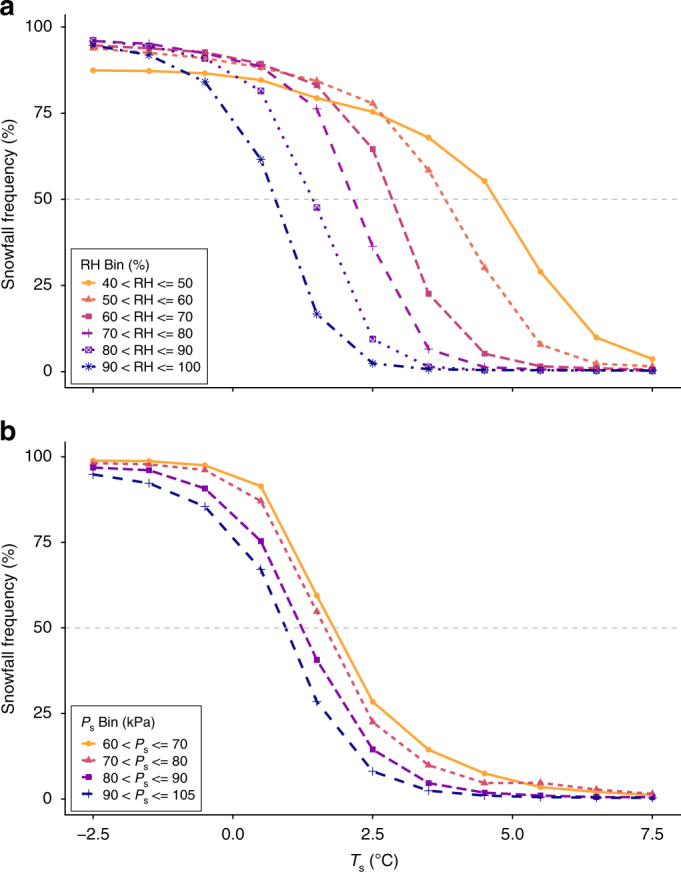
Fig. 2.

Snowfall frequency curves calculated using observations from 11,924 stations across the Northern Hemisphere (1978–2007). a Snowfall frequency curves plotted by RH bin. b Snowfall frequency curves plotted by Ps bin. The 50% rain–snow Ts threshold for each of the RH and Ps bins are as follows: 4.5 °C (40–50%), 3.7 °C (50–60%), 2.8 °C (60–70%), 2.2 °C (70–80%), 1.4 °C (80–90%), 0.7 °C (90–100%), 1.9 °C (60–70 kPa); 1.7 °C (70–80 kPa), 1.3 °C (80–90 kPa), and 0.9 °C (90–105 kPa). Standard error bars are not plotted due to the large number of observations per RH, Ps, and Ts bin (all standard errors are less than 0.9%). (The snowfall frequency curves for all Northern Hemisphere observations by Ts, Tw, and Td are available in Supplementary Fig. 1.)
