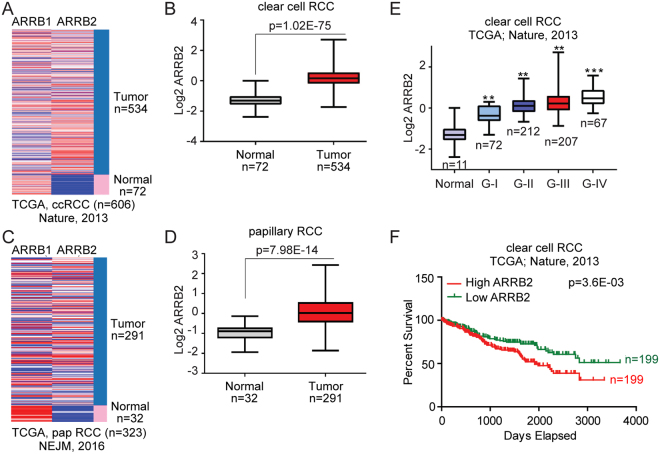
Figure 1.
ARRB2 is abundantly expressed in human RCC. (A) Heat map generated from The Cancer Genome Atlas (TCGA) database showing relative expression of ARRB1 and ARRB2 in normal and ccRCC patients. (B) Box and whisker plots for ARRB2 gene expression in ccRCC patient compared to normal. Log2-normalized read count [RNA-seq by expectation-maximization (RSEM)] is shown. (C) Heat map showing ARRB1 and ARRB2 genes expression in normal and papillary carcinoma patients from TCGA. (D) Box and whisker plots for ARRB2 in papillary RCC patient compared to normal. (E) Box and whisker plots represent ARRB2 gene expression for tumor samples stratified according to histologic grade. (F) Kaplan–Meier survival plot represents overall survival of ccRCC patients in TCGA for RCC patients categorized according to ARRB2 gene expression (high vs low in comparison to the median expression). For panels (B,D) and (E) the P values were calculated using a log-rank test. Box plot line (from top to bottom): maximum; Q3, third quartile; median; Q1, first quartile; and minimum. P values were calculated by using two-tailed paired Student’s t test. Data shown are mean ± SEM, **P < 0.001 and ***P < 0.0001.

