Figure 3.
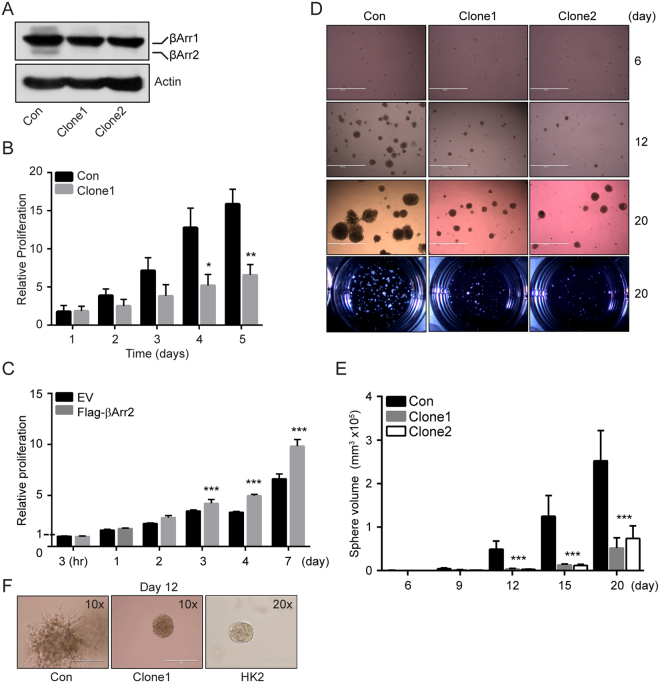
Knockout of βArr2 inhibits cell proliferation. (A) βArr2 knockout in SN12C cells. SN12C cells were infected with lentivirus CRISPR/Cas9 containing sgRNA targeting exon 3 (Arrb2ex3-14; Clone1) or exon 4 (Arrb2ex4-12.19; Clone2) respectively. The expression levels of βArr2 in knockout cells were analyzed by Western blot. Control (Con) SN12C cells were infected with lentivirus CRISPR/Cas9 that contains no sgRNAs. (B) Cell proliferation assay. Bars represent the average proliferation rate of control and βArr2ko Clone1 cells over time relative to the number of control cells after 1 day of incubation. (C) Cell proliferation assay. Bars represent the fold change in proliferative rate of empty vector (EV) and Flag-βArr2 CAKI-1 cells relative to the number of EV CAKI-1 cells after 3 hr incubation. (D) Sphere growth assay. Control or βArr2ko Clone1 and Clone2 single (500) cells were seeded in matrigel and allowed to grow for 20 days. Sphere sizes were captured every 3 days till day 15 and at endpoint day 20. Images shown are representative of growth at days 6, 12, and 20. Bird’s eye view of the wells at the end point are also shown. (E) Bars represent the average volume of 20 spheres from panel D analyzed at the indicated time point. (F) Images of spheres (control and βArr2ko Clone1) at 10× magnification and HK2 sphere at 20× magnification on day 12. For panels B, C and E, data shown represent the average ± SD for three independent trials. *P < 0.05, **P < 0.001 and ***P < 0.0001.

