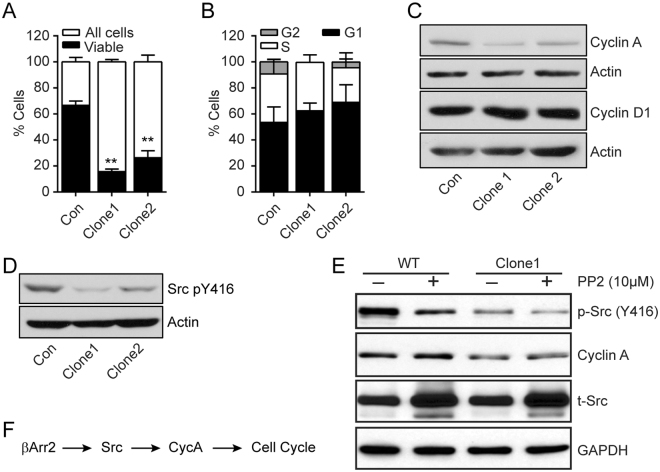
Figure 6.
βArr2 regulates cell cycle progression. (A) Cell cycle analysis. Control and βArr2ko (5 × 10⁴) cells were counted using LSRII flow cytometer and analyzed for cell cycle status. Bar-plot representation of the distribution of viable cells compared to total cells. **P < 0.001. (B) Bar-plot representation of the distribution of viable gated cells in G1 (P = 0.6311), S (P = 0.6974) and G2 (P = 0.0253) phase. (C) Representative images of Cyclin A and Cyclin D proteins expression in control and βArr2ko cells. Actin served as a loading control. (D) Representative images depicting active c-Src. Cell lysates were blotted with anti-c-Src pY416 antibody. Actin served as a loading control. (E) Inhibition of c-Src depletes expression of Cyclin A. Cells were treated with PP2 (10 μM) for 24 hr followed by western blotting to detect the indicated proteins. Total c-Src (t-Src) and GAPDH served as loading controls. (F) Schema depicting cell cycle regulation.

