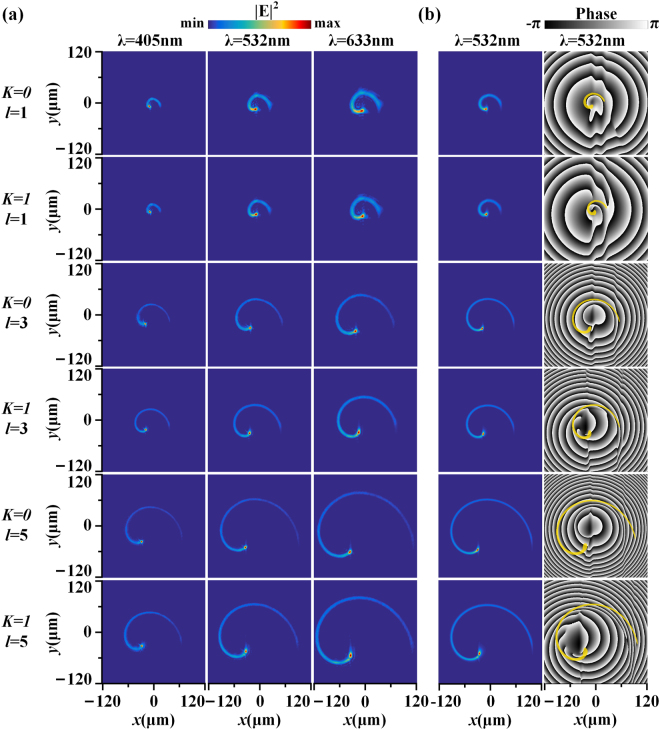
Figure 6.
(a) Measured intensity profiles at the focal plane of z = 200 μm. Form the first row to the last row, the corresponding HC metasurface parameters change with the order: (K = 0, l = 1), (K = 1, l = 1), (K = 0, l = 3), (K = 1, l = 3), (K = 0, l = 5) and (K = 1, l = 5). And from left column to right column, the laser wavelength changes with the order 405 nm, 532 nm and 633 nm. (b) Simulated intensity and phase profiles at the focal plane of z = 200 μm at 532 nm. The yellow spiral curves in the phase profiles represent the intensity trajectories.

