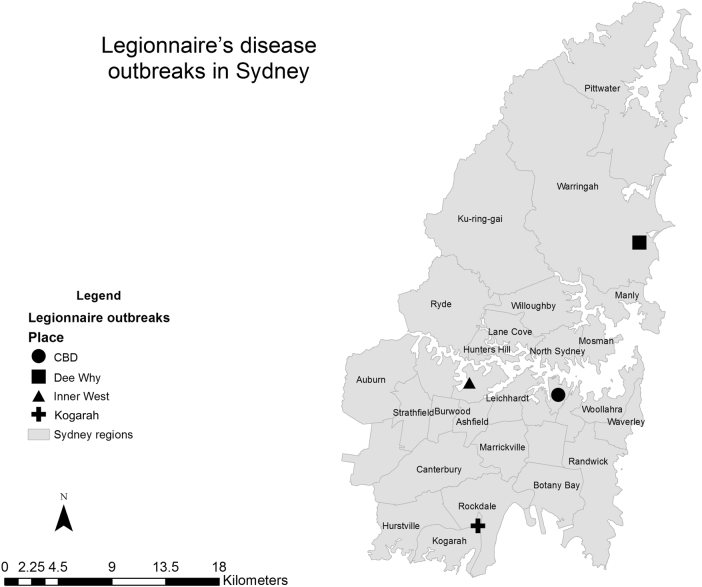
Fig. 5. Location of Legionnaries’ disease outbreaks in Sydney, Australia from 27 February 2016 to 29 April 2016.
Outbreak locations are represented by circle (CBD district), square (Dee Why), triangle (Inner West) and cross (Kogarah) shapes. Grey areas represent the administrative districts within the Sydney region. Data source of outbreak data: NSW Health26. Base map data was taken from the Australian Standard Geographical Classification (ASGC) Digital Boundaries, Australia14. Coordinates of outbreak locations retrieved by searching names of locations on Google maps. Maps were created using ArcMap 10.2

