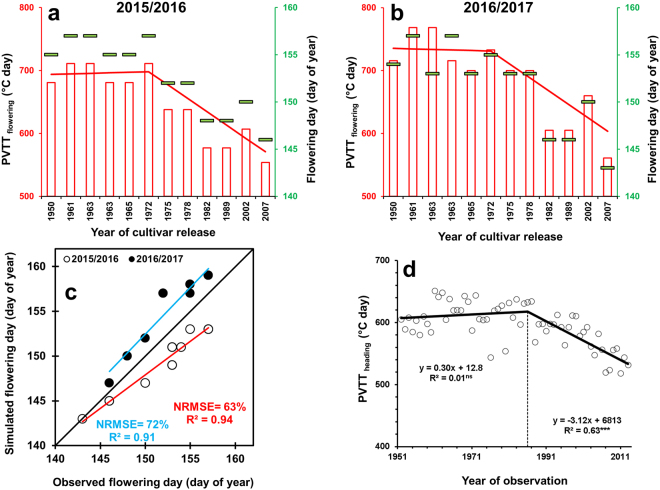
Figure 2.
Cultivar-specific flowering day observed in the field experiment in 2015/2016 (a) and 2016/2017 (b); photo-vernal-thermal time (PVTT, °C day) from emergence to flowering calculated for 2015/2016 (a) and 2016/2017 (b); the 1:1 plot showing a cross validation of the phenology model by simulating the flowering day in 2016 by using the PVTT from 2016/2017 and simulating the flowering day in 2017 by using the PVTT from 2015/2016 (c); and the PVTT from emergence to heading (d) obtained from the long-term (1952–2013) phenology observations across western Germany.

