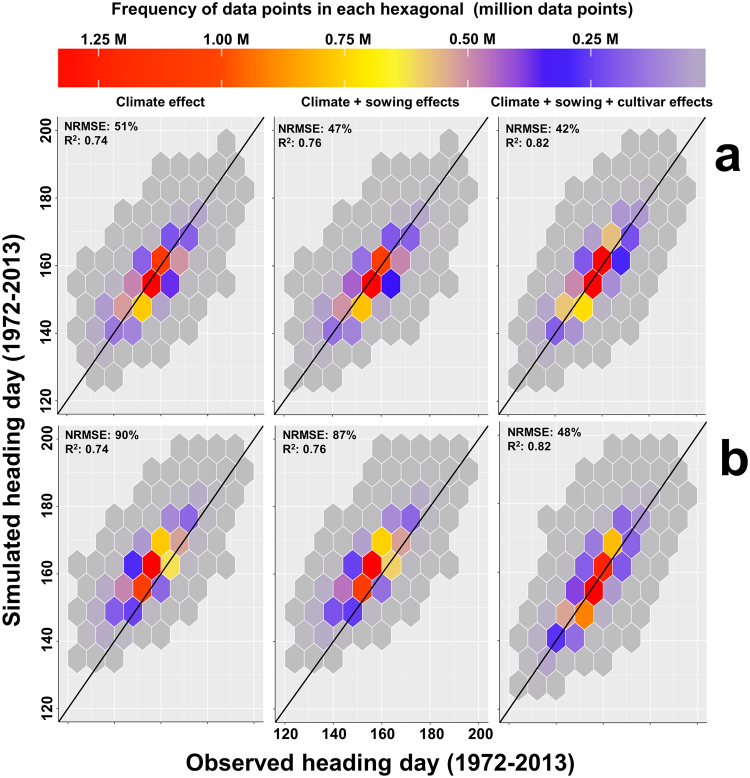
Figure 5.
The 1:1 hexbin plot of the simulated (parameterized by the first (a) and second year (b) of the field experiment) and observed heading day based only on the climate effect, combined climate and sowing effects and combined climate, sowing and cultivar effects at a 1 km × 1 km resolution in the period 1972–2013 across western Germany. The color of each hexagonal cell shows the number of the simulated and observed points at each cell. Each panel of the figure included 12.5 million data points.

