Fig. 1.
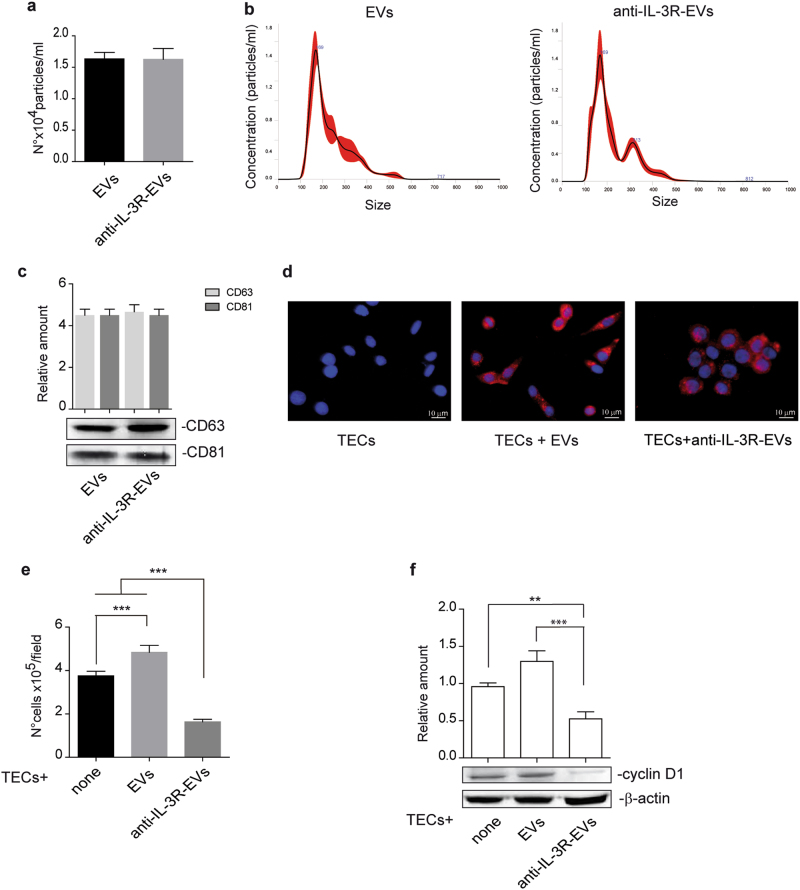
Internalization and proliferation in response to TEC-derived EVs and anti-IL-3R-EVs. a Number of EV particles (mean ± SD) was calculated per ml. Data refer to EV-derived from untreated TECs (EVs) or anti-IL-3Rα blocking antibody-treated TECs (anti-IL-3R-EVs) (n = 4, unpaired t-test). b Representative images of NanoSight analyses performed on the 100 k fraction of TEC-derived EVs, showing a mean dimension, for both EVs, of 169 nm (n = 3). c TEC-derived EVs were analyzed for CD63 and CD81 exosomal markers by western blot analysis (n = 4, unpaired t-test). d Representative confocal microscopy images of TECs, either untreated or treated for 3 h with the indicated PKH26-labeled EVs, to evaluate EV up-take TECs. (n = 4). Scale bars indicate 10 μm (40× magnification). e Cell proliferation assay was performed in TECs untreated (none) or treated for 24 h with EVs or anti-IL-3R-EVs and reported as number of cells per field (mean ± SD, 20× magnification) (n = 5) (***p < 0.001, none vs EVs; ***p < 0.001, none and EVs vs anti-IL-3R-EVs, one-way ANOVA). f TECs, either alone or stimulated with EVs or anti-IL-3R-EVs, were lysed and analyzed for cyclin D1 content. Protein levels were normalized to β-actin content (**p < 0.01, none vs anti-IL-3R-EVs; ***p < 0.001, EVs vs anti-IL-3R-EVs, one-way ANOVA) (n = 4)

