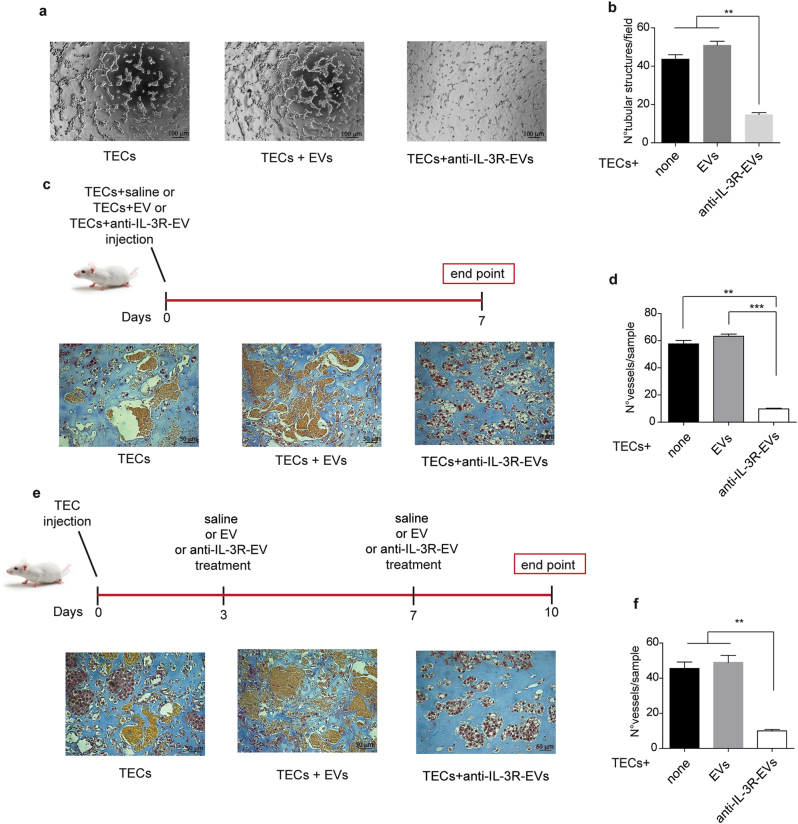
Fig. 2.
Anti-IL-3R-EVs impair vessel formation. a, b Representative photomicrographs of an in vitro angiogenesis assay, showing tube-like structure formation by TECs, either untreated or treated with 7 × 10³/cell EVs or anti-IL-3R-EVs. Data are reported in the histogram as number ± SD of tubular structures per field (**p < 0.01, none and EVs vs anti-IL-3R-EVs, one-way ANOVA) (n = 4, 10× magnification). Scale bars indicate 100 μm. c, d Representative images of an in vivo angiogenesis assay, performed by injecting Matrigel matrices containing either 1 × 10⁶ TECs and 1 × 10⁵/cell of EVs or anti-IL-3R-EVs into the flank of SCID mice. Saline was the internal control. As shown by the timeline, plugs were recovered on day 7 after implantation. Data are reported in the histogram as number ± SD of vessels per sample (**p < 0.01, none vs anti-IL-3R-EVs; ***p < 0.001, EVs vs anti-IL-3R-EVs, one-way ANOVA) (20× magnification). Scale bars indicate 50 μm. e, f Representative images of an in vivo angiogenesis assay to evaluate the ability of anti-IL-3R-EVs to impair the growth of tumor vessels. The timeline and the endpoint are indicated. Data are reported in the histogram as number ± SD of vessels per sample (**p < 0.01, none and EVs vs anti-IL-3R-EVs, one-way ANOVA) (20× magnification). Scale bars indicate 50 μm

