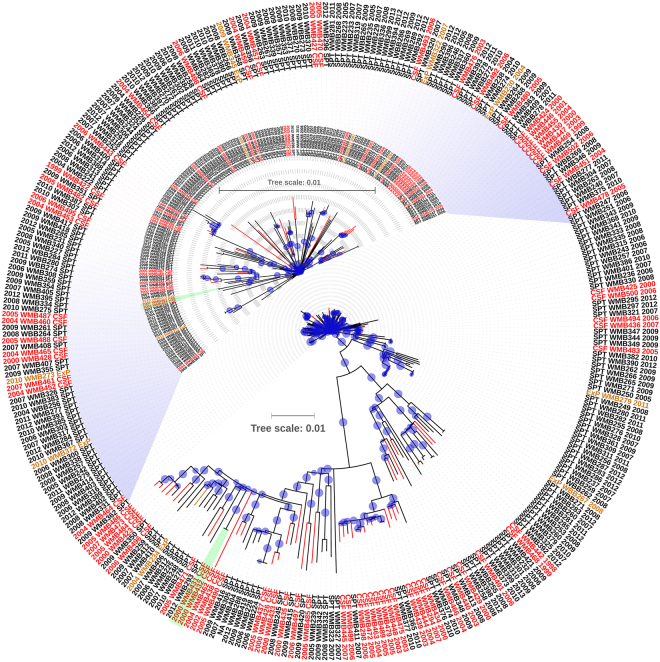
Figure 1.
Phylogenetic analysis of M. tuberculosis isolates from TBM and PulTB patients. The phylogenetic tree was inferred using the maximum likelihood method with general time reversible and gamma distribution model using 4,490 high-confidence SNPs and compared to the H37Rv reference genome. The bootstrap consensus tree was inferred from 1,000 replicates. Blue circles refer to bootstrap values and the size of each circle is proportional to its value (most of the bootstrap values are 100). Black, red and orange branches and letters refer to Mtb isolates from sputum (SPT) of PulTB cases, cerebrospinal fluid (CSF) of TBM cases, and extrapulmonary (ExP) samples other than CSF, respectively. The upper portion of the tree has been magnified as an inset. Two small clusters of Mtb isolated from TBM patients are indicated in green boxes. Numbers in the outer ring (e.g. 2009) refer to year of collection and NA indicates unavailable data.

