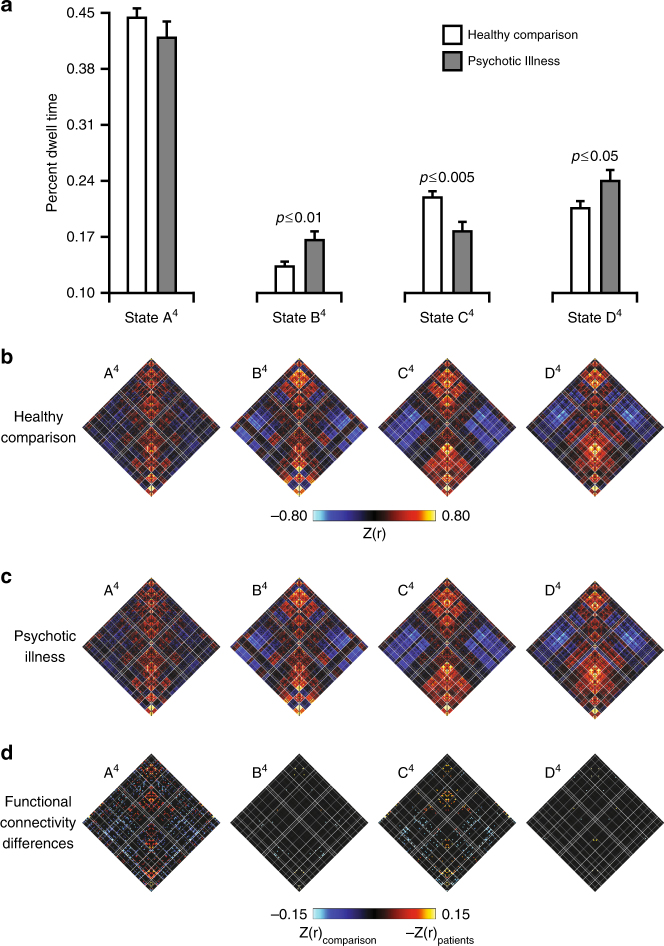
Fig. 6.
Psychotic illness links to state-specific reductions in connectivity. a Bar graphs display the percent of time healthy comparison participants and individuals with psychotic illness dwell in each state of the four-state solution. b–c The 2D grids (b–c) display the complete coupling architecture of the cerebral cortex measured at rest for each group of participants. d Differences were obtained by an analysis of variance of z-transformed Pearson correlation values after linear regression of the effects of age, sex, race, ethnicity, and handedness [r(z)Comparison – r(Z)Patient group]. The bottom panel shows significant group differences at false-discovery rate q ≤ 0.05

