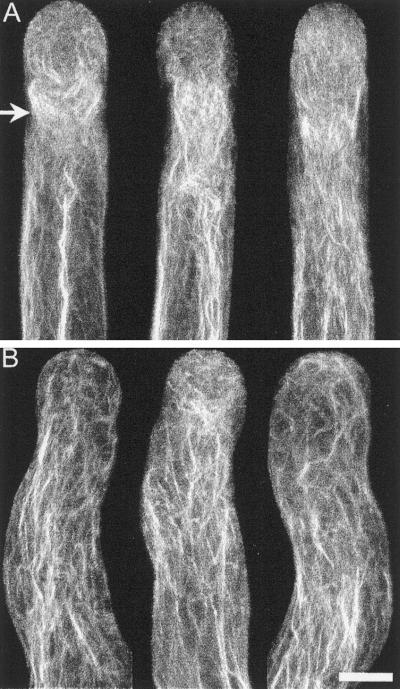
Figure 9.
F-actin distribution of cells treated with 2 nM latrunculin B. Treated cells after chemical fixation and Alexa-phalloidin staining. (A) Control cells. (B) Cells treated with 2 nM latrunculin B for 20 min before fixation. F-actin was visualized by confocal microscopy; the images are projections of 30 optical sections at 0.5-μm intervals in the Z-axis. There is a video file with a 3-dimensional reconstruction and rotation linked to the first projection from each panel (Videos 3 and 4). Note the prominent subapical funnel-shaped F-actin rich region (arrow in A) that is absent in the treated cells. Bar, 10 μm.

