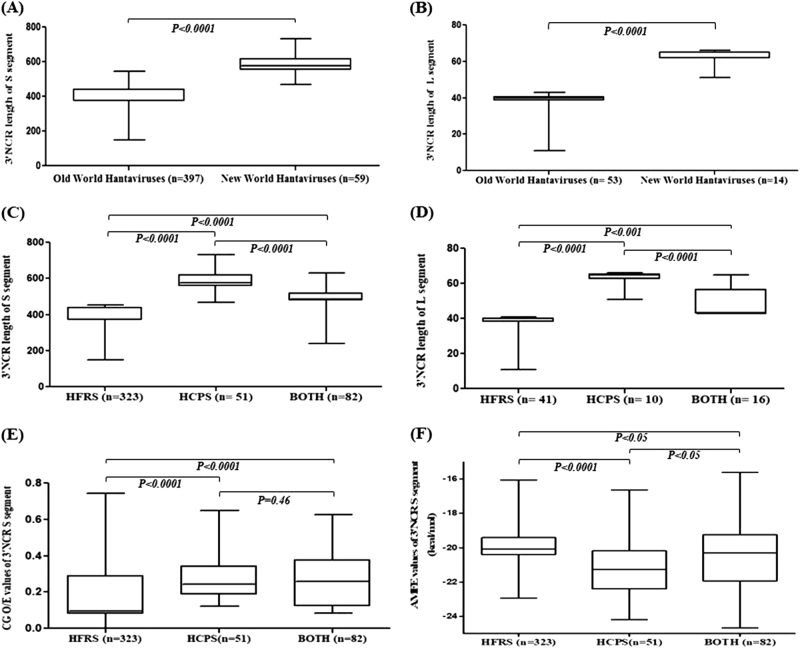
Fig. 1.
Differences in the 3´ NCR lenghts, CpG content and adjusted minimum free energy (AMFE) values among hantaviruses. Box plots showing the distribution of 3′ NCR length among the Old World Hantaviruses and New World Hantaviruses in" and please revise this figure legend as follows:Box plots showing the distribution of 3′ NCR length among the Old World Hantaviruses and New World Hantaviruses in (a) the S- segment and (b) the L- segment. Box plots showing the distribution of 3′ NCR length of (c) the S- segment and (d) the L- segment among hantaviruses causing HCPS, HFRS, or both. Box plots showing the distribution of (e)CpGO/E values and (f) adjusted minimum free energy (AMFE) values for the 3′ NCR of the S- segment. "?>Box plots showing the distribution of 3′ NCR length among the Old World Hantaviruses and New World Hantaviruses in a the S-segment and b the L-segment. Box plots showing the distribution of 3′ NCR length of c the S-segment and d the L-segment among hantaviruses causing HCPS, HFRS, or both. Box plots showing the distribution of e CpGO/E values and f adjusted minimum free energy (AMFE) values for the 3′ NCR of the S-segment

