Figure 6.
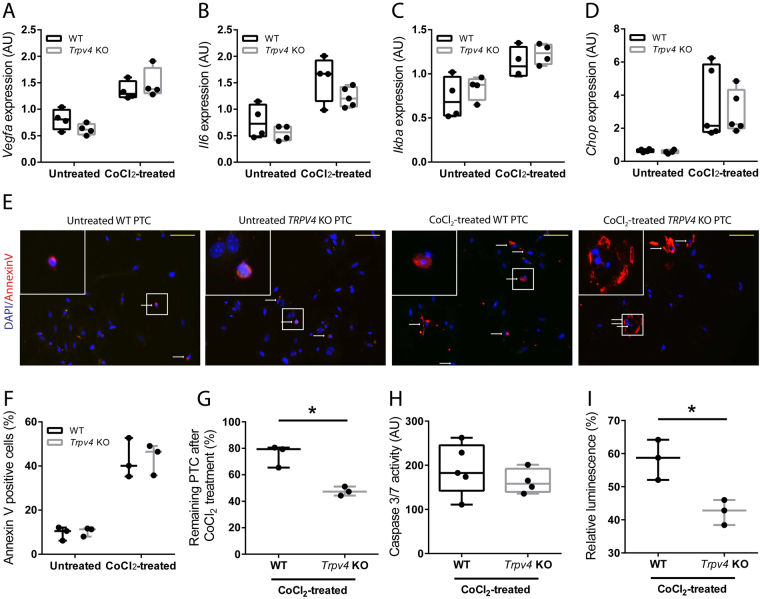
Treatment of primary proximal tubular cells (PTCs) of WT and Trpv4 KO mice with hypoxia-inducible factor 1-alpha (HIF1α)-stabilizing agent CoCl2. mRNA expression of (A) HIF1α target gene Vegfa, (B) stress cytokine interleukin 6 (Il6), bona fide NF-κB target gene nuclear factor of kappa light polypeptide gene enhancer in B-cells inhibitor alpha (IkBa), and (D) endoplasmatic reticulum stress marker CCAAT/enhancer binding protein homologous protein (Chop). Each dot is a mean of 2 technical repeats and represents a pool of PTCs isolated from 2–3 animals of the same genotype. Data of two independent experiments. n = 4 for untreated and n = 5 for CoCl2-treated WT and Trpv4 KO PTCs, two-way ANOVA. In all cases PTreatment < 0.05, and PGenotype and PInteraction are not significant. (E) Representative ×200 images of Annexin V-stained (red) untreated WT and Trpv4 KO PTCs and of PTCs 24 hours after treatment of 300 μM hypoxia-mimetic agent CoCl2. Nucleus was stained with 4’,6-diamidino-2-phenylindole (DAPI) (blue). White arrows indicate Annexin V–positive tubular cells. Yellow bars represent 100 μm. (F) Quantification of Annexin V-positive PTCs in the respective groups. Each dot is a percentage of the mean Annexin V-positive cells/negative cells in 7–10 randomly selected high-power fields. Data of three independent experiments. Two-way ANOVA, PTreatment < 0.05, and PGenotype and PInteraction are not significant. (G) Quantification of DAPI-positive WT and Trpv4 KO PTCs after a 24-hour treatment with 300 μM CoCl2. Each dot represents the percentage of the remaining DAPI-positive PTCs. To calculate the mean DAPI-positive PTC number of untreated and treated PTCs, 7–10 randomly selected high-power fields were counted and percentage was calculated. Data of three independent experiments. (H) Caspase 3/7 activity measured by the Caspase-Glo 3/7 Assay. Each dot is a ratio of the relative fluorescence of CoCl2-treated PTC/untreated PTC (background). n = 5 for CoCl2-treated WT and Trpv4 KO PTCs. (I) Percentage of viable PTCs measured by CellTiter-Glo Luminescent Cell Viability Assay. Luminescence of WT and Trpv4 KO PTCs after a 24-hour treatment with 300 μM CoCl2 was measured and was divided by the luminescence of their respective untreated controls and multiplied by 100. Data of three independent experiments, each experiment is a mean of 3–5 samples.

