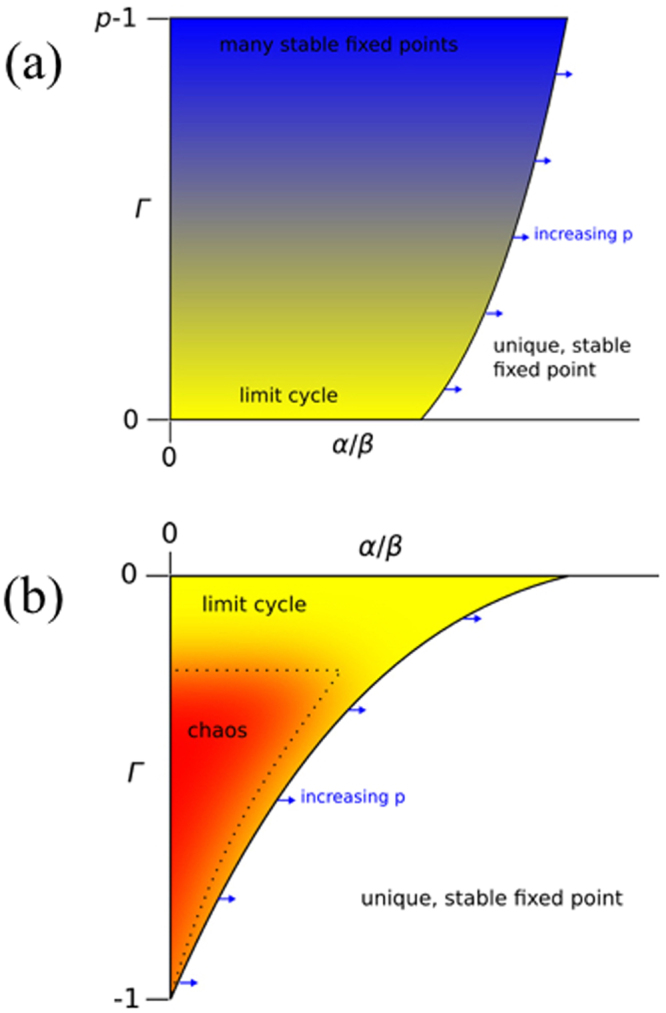
Figure 3.

Schematic phase diagrams describing the observed long-term behaviour of the p-player EWA system for large but finite N. In (a) Γ > 0, meaning players’ payoffs are positively correlated. Here we observe a unique stable equilibrium for large α/β and multiple stable equilibria for small α/β. In (b) Γ < 0, meaning players’ payoffs are anti-correlated. Here we once again observe a unique stable equilibrium for large α/β, but we now observe chaos for small α/β. Limit cycles are common near the boundaries, particularly near Γ ≈ 0. The solid line in panel (b) illustrates that there is a region in which the dynamics is either chaotic or runs into a limit cycle. The dotted line indicates that, within that unstable region, there is a smaller region of particularly high dimensional chaos. This is for illustration only, quantitative details of the phase boundaries between stable and unstable dynamics will be discussed below.
