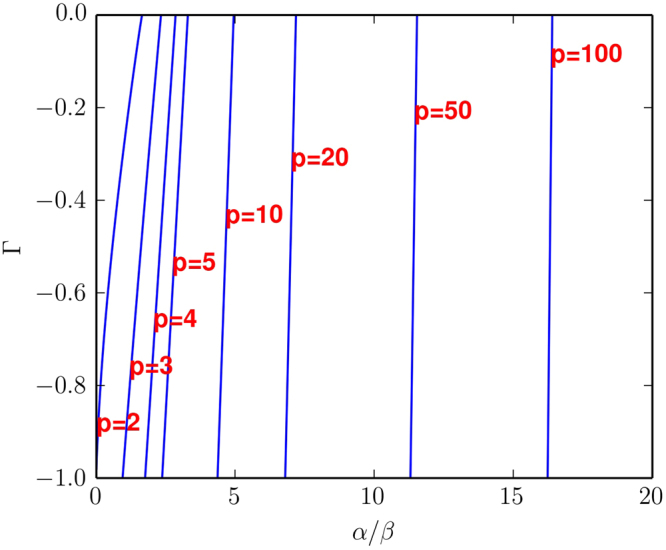
Figure 4.

Stability boundaries of the effective dynamics for several values of p as a function of α/β and Γ, for the case where Γ < 0. Each curve is the stability boundary for the stated value of p. To the left of any curve the fixed point of the effective dynamics is unstable, to the right it is stable. The key result is that the stability boundary moves to the left as p increases, so the size of the regime with complex dynamics grows.
