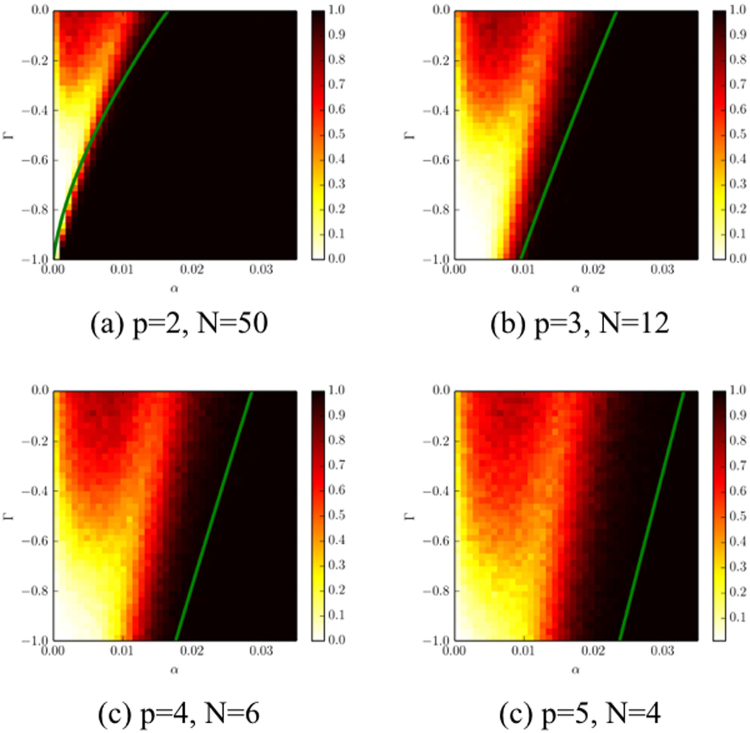
Figure 6.
Probability of convergence to a fixed point as a function of the memory parameter α and the competition parameter Γ. For each set of parameters we iterate the system from 500 random initial conditions. The heat maps show the fraction that converged to a fixed point. Black means 100% convergence, red (grey) indicates the majority converge, yellow a minority, and white no convergence. The unstable region extends to larger values of α as the number of players is increased. The solid curves are derived from the generating functional analysis described above (in the limit N → ∞). They separate the region in which a unique stable fixed point is to be expected in this limit (to the right of the green curves) from regions in parameters space where the behaviour is more complex.

