
FIGURE 2.
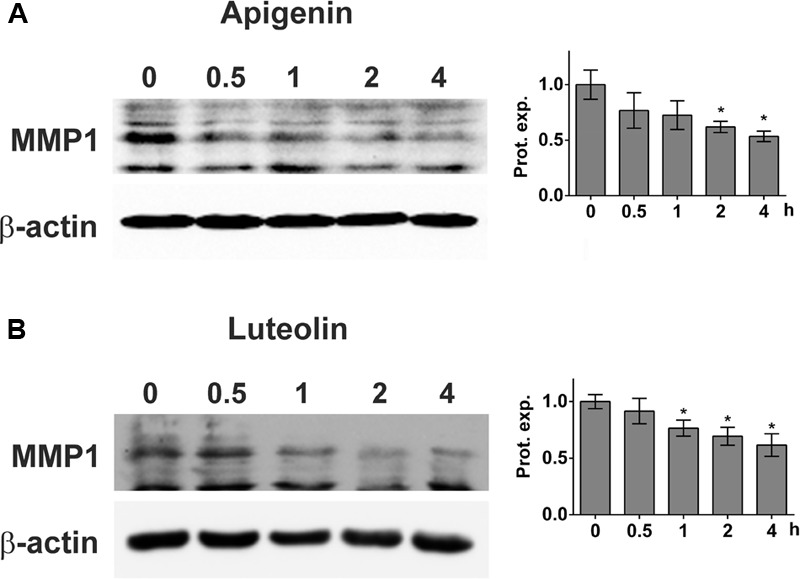
Inhibition of MMP1 expression upon flavonoid treatment. MDA-MB231 cells were grown to ∼80% confluence and then treated with solvent (0), or (A) 20 μM apigenin, or (B) 20 μM luteolin for 0.5, 1, 2, and 4 h. Then, cells were lysed, proteins separated by SDS gel electrophoresis and subjected to Western blotting using the indicated antibodies. Staining with Ponceau S and immunoblotting with anti-β-actin antibody controlled equal sample loading. Relative protein expression levels (Prot. expr.) are shown to the right of the blots. Densitometries are means ± SEM from at least three experiments (asterisks indicate significances, p < 0.05; t-test) and the Western blot images are representatives for illustration.