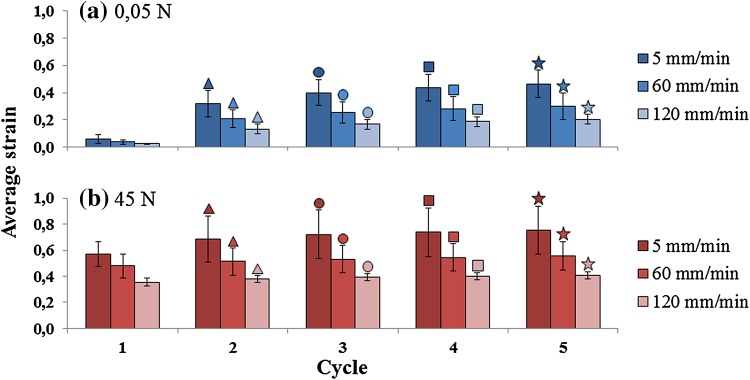
Figure 3.
Average strain calculated at every cycle of loading for the group loaded with 45 N. The other groups show the same trend at lower strain values (Fig. 4). (a) Rest load of 0.05 N; comparison within loading rates of 5, 60 and 120 mm/min. The average strain values in rest loading ranges between 0.06 and 0.46 at 5 mm/min; 0.04–0.3 at 60 mm/min; and 0.03–0.21 at 120 mm/min. (b) Peak load of 45 N; comparison within loading rates of 5, 60 and 120 mm/min; n = 6 per loading rate group. The average strain values in peak loading ranges between 0.57 and 0.75 at 5 mm/min; 0.48–0.56 at 60 mm/min; and 0.36–0.41 at 120 mm/min. There are statistically significant differences within each cycle of 0.05 N (p < 0.005; blue bars,) and within each peak-loading (p < 0.005; red bars). Every specific symbol (open triangle, open circle, open square, filled star) and color is showing the statistically significant difference between the marked cycle and the previous one. Significance at p < 0.05.

