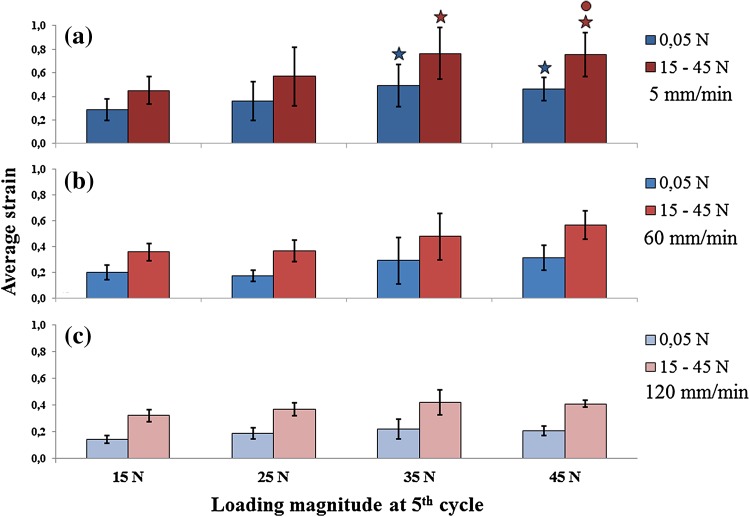
Figure 4.
Average strain calculated at 5th cycle of loading for each loading magnitudes applied (horizontal axis, values under bottom graph only). Top: loading rate 5 mm/min. Middle: loading rate 60 mm/min. Bottom: loading rate 120 mm/min. Filled star: statistically significant difference with 15 N; open circle: statistically significant difference with 25 N. Significance at p < 0.05.

