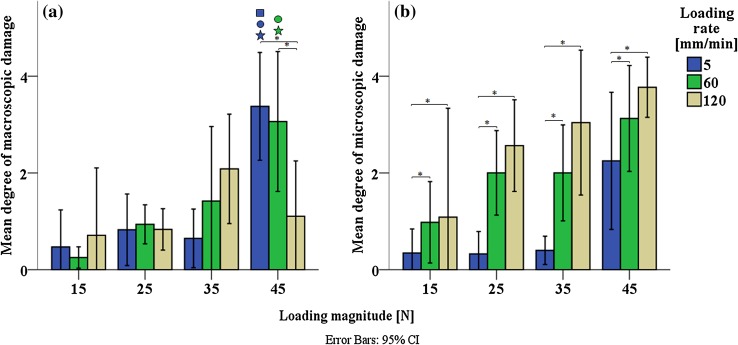
Figure 6.
Degree of macroscopic superficial damage (a). Degree of microscopic internal damage (b). Error bars represent 95% confidence intervals. Filled star: statistically significant difference with 15 N; open circle: statistically significant difference with 25 N; open square: statistically significant difference with 35 N; asterisk: statisitically significant difference with 5 mm/min. Filled star, open circle, open square and asterisk: p < 0.05.

