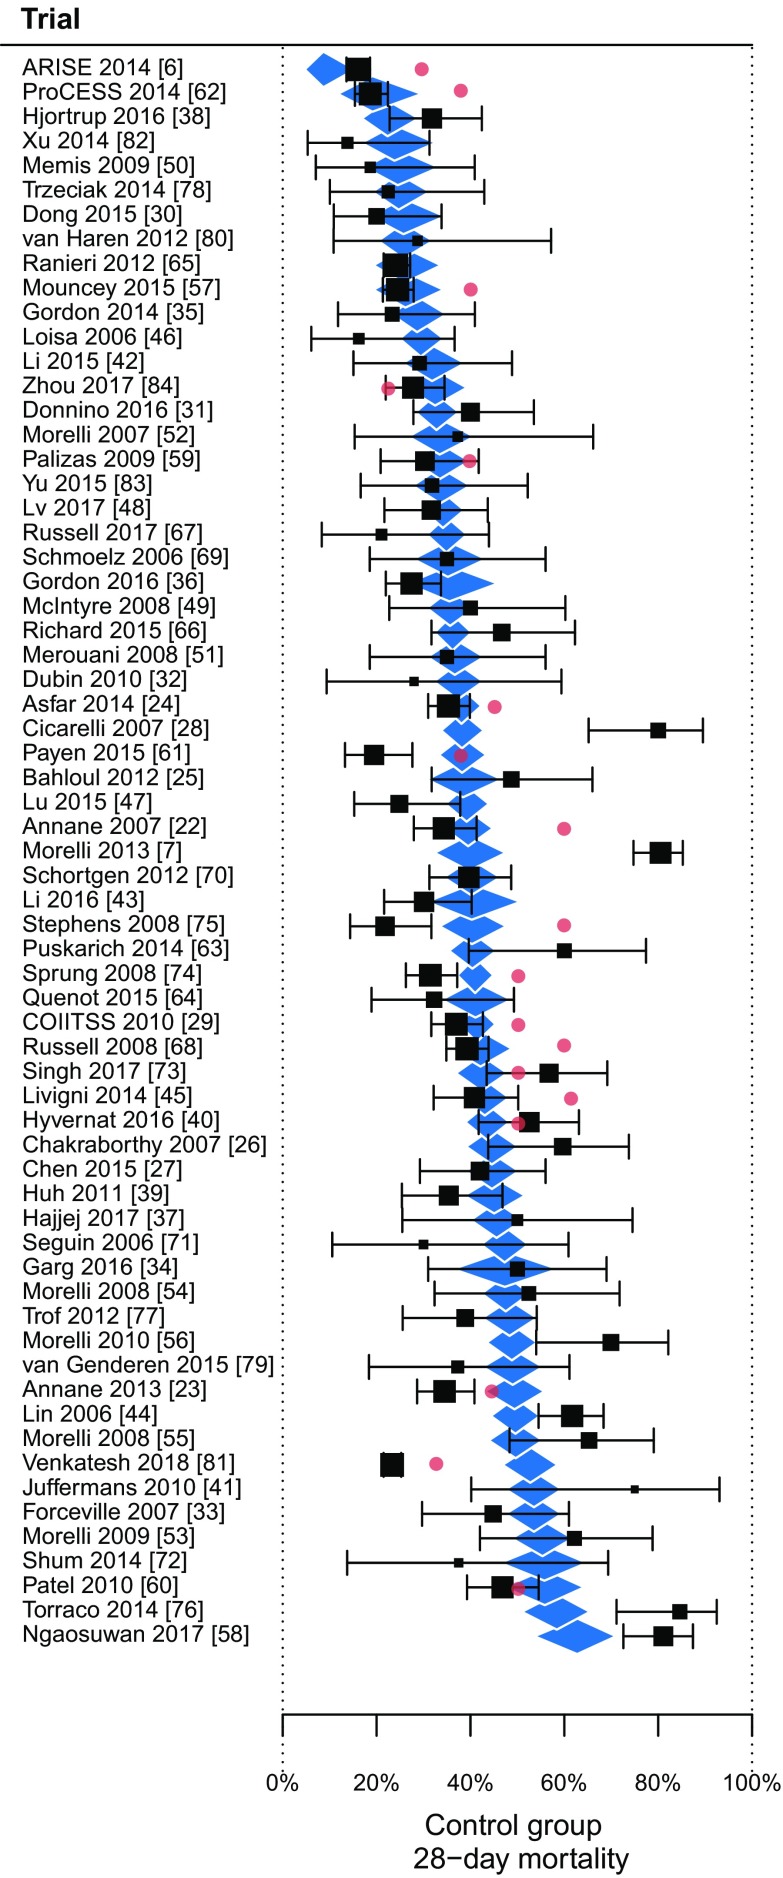
Fig. 3.
Included trials ordered by predicted control group mortality rate (diamonds). The predicted mortality rates were based on a multivariate weighted random-effects regression model with baseline mean Sequential Organ Failure Assessment (SOFA) score, the proportion of patients on mechanical ventilation, and mean serum creatinine as significant independent variables. The squares and brackets are the observed control-group mortality rates with 95% confidence interval. The figure illustrates that the model explained (R2) 41% of the variability in mortality rates, with significant residual heterogeneity (P < 0.0001). The red dots are the reported a-priori expected mortality rates used for sample size calculations

