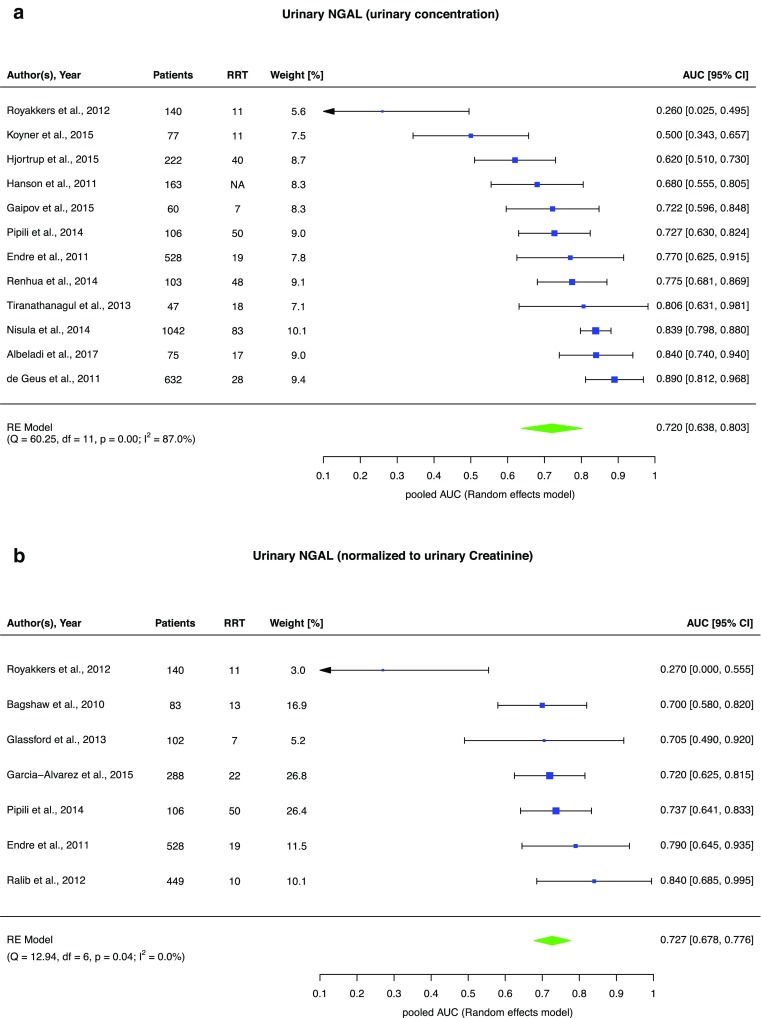
Fig. 1.

Forest plots of urinary NGAL predicting RRT. a Urinary concentration of NGAL. b Urinary NGAL normalized to urinary creatinine. AUC area under the curve, RE Model random effects model, CI confidence interval, RRT renal replacement therapy (i.e., number of patients having received RRT)
