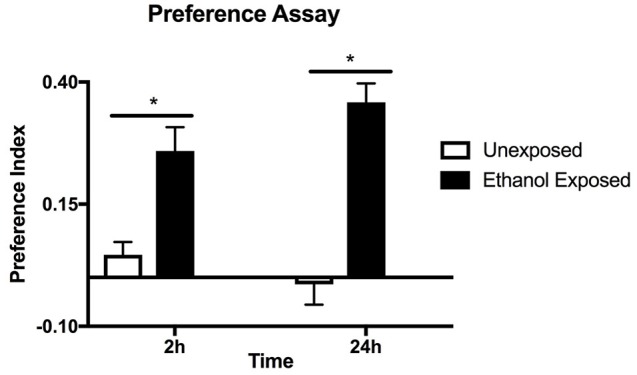
Figure 1.

Preference assay for naive or ethanol exposed flies. Preference indices were measured at 2 and 24 h in the same batch of flies. Columns represent three independent experiments, each consisting of three assay tubes containing 6–8 flies each. n = 9. Error bars are SEM. Statistical significance was measured by two-way ANOVA with Bonferroni multiple comparisons test. The effect of alcohol treatment was highly significant p < 0.0001 (horizontal line with*). The effect of time was not significant p = 0.635.
