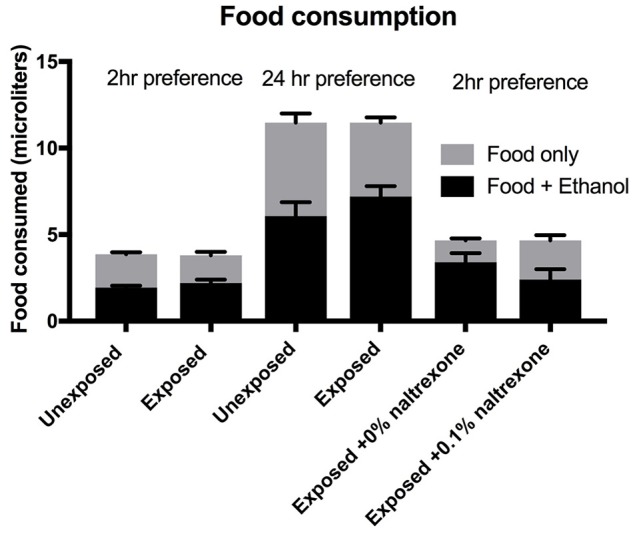
Figure 4.

Food consumption. Flies were either exposed or unexposed to 15% ethanol for 48 h or exposed to ethanol for 48 h followed by treatment with 0 or 0.1% naltrexone. The consumption was measured over a period of 2 or 24 h as indicated. Each column represents triplicate assays containing 6 flies each, n = 3. Error bars are SEM. One-way ANOVA with Kruskall-Wallis multiple comparison analysis showed no significant difference (p > 0.9) between any of the groups where consumption was measured for the same length of time. The Preference indices for the data shown for this figure for the 6 columns left to right are 0.0; 0.16; 0.02; 0.26; 0.48; 0.03.
