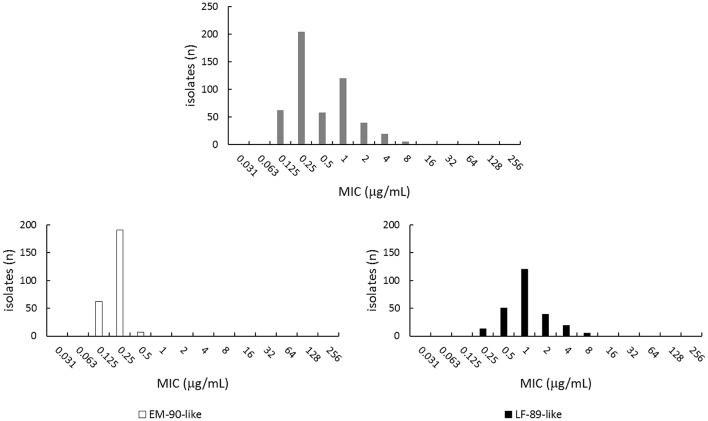
Figure 1.
Florfenicol susceptibility profiles deduced from the dataset published in Saavedra et al. (2016). The upper plot shows the MIC distribution as displayed by the whole collection, which contains EM-90-like and LF-89-like P. salmonis isolates. The lower panels show strain-specific MIC distributions.

