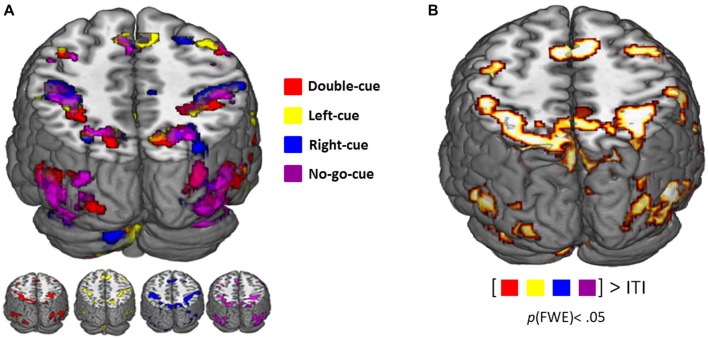
Figure 2.
(A) Functional magnetic resonance imaging (fMRI) activity related to the presentation of the predictive cues (pFWE-corrected < 0.05). Color coding corresponds to the different trial types (see legend). (B) Consistent cue-evoked activation (relative to implicit inter trial interval (ITI) baseline; pFWE-corrected < 0.05) in superior parietal lobes (SPL), dorsal premotor cortex (PMd), supplementary motor area (SMA), middle frontal gyrus (MFG), inferior frontal gyrus (IFG), occipital areas, cerebellum across all participants.

