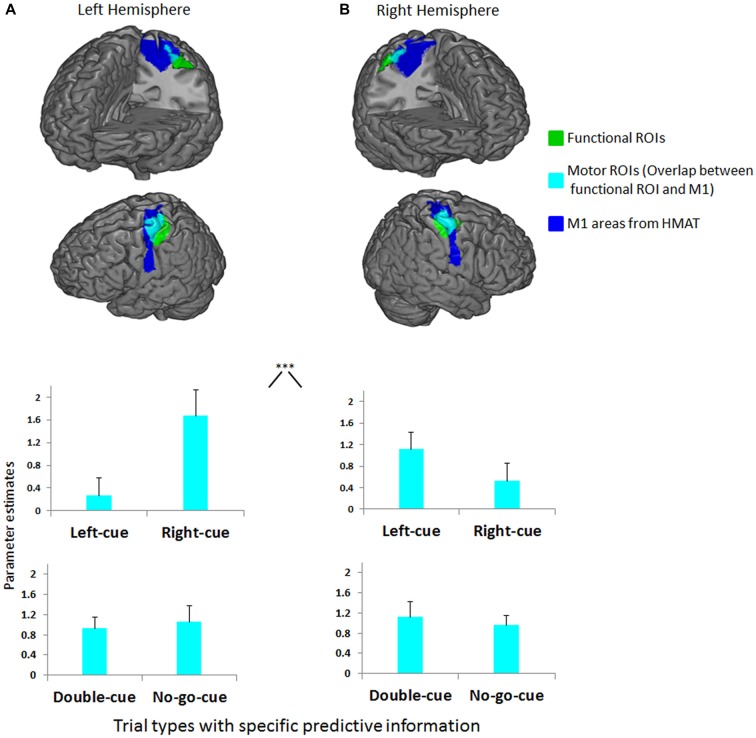
Figure 3.
(A) Left functional ROI (green) and its overlap (cyan) with left primary motor cortex (M1) anatomical inclusive mask (blue). (B) Right functional ROI (green) and its overlap (cyan) with right M1 anatomical inclusive mask (blue). Depicted on both upper graphs are the mean parameter estimates of the left-cue and right-cue events extracted from both motor ROIs for each trial type. The graphs show a clear interaction between M1 side (left, right) and trial type (***p < 0.001). Activity before movement onset in contralateral M1 increases as the competition is biased in favor of a specific button press relative to activity in ipsilateral M1. Depicted on both lower graphs are the mean parameter estimates of the double-cue and no-go-cue events extracted from both motor ROIs for each trial type. No differences were observed between double-cue and no-go-cue elicited activity. Error bars on all graphs denote the standard error of the mean.

