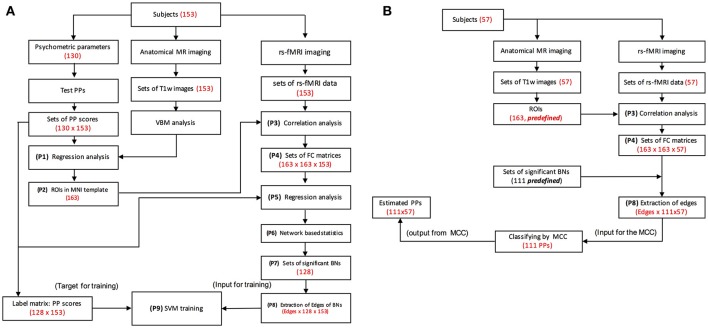
Figure 1.
Procedure for MRI data processing. P1, P2, etc., stand for processing steps. (A) Diagrams of data flow for the primary experiment. Brain areas are identified by psychometric parameters and MRI data by regression analysis (P1, P2). fMRI signals are extracted from the ROIs, and the correlation matrix is constructed (P3, P4). Regression analysis and network based statistics (NBS) analysis were performed for the correlation matrices of 153 subjects (134 for IQ and 123 for EQ), and significant brain networks are identified (P5, P6, P8). Inputs to the SVM classifiers are determined from the edges of the identified functional networks (P7, P8). Scores of psychometric parameters are estimated by classifiers and compared with psychologically measured scores to calculate accuracy. Numbers and letters in the parenthesis stand for specific information obtained after the processing at each step. PP, psychometric parameter; SVM, support vector machine; rs-Fmri, resting-state functional MRI; FC, functional connectivity; BN, brain network; MCC, multiple class classifiers; T1w, T1 weighted. (B) Diagrams of data flow for the supplementary experiment. Bypassing the regression analyses used during training, fMRI signals are extracted from the ROIs, and the edges of functional networks are calculated (P3, P4, P8) for input into the SVM classifiers (P9). Scores of psychometric parameters are estimated by the classifiers.

