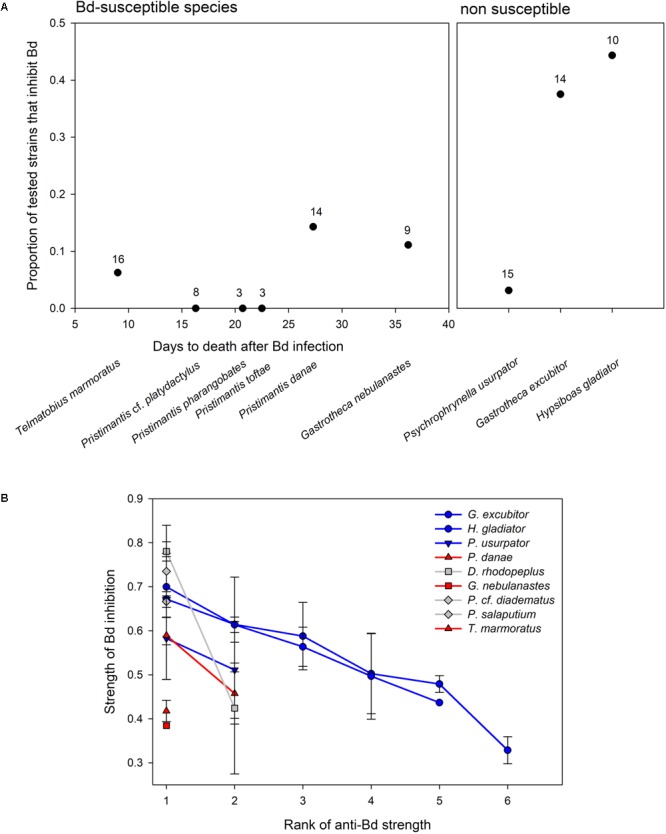
FIGURE 3.

(A) Variation in proportion of anti-Bd bacterial isolates in Bd-susceptible and non-susceptible amphibian hosts. In susceptible species, days to death after Bd infection are calculated from survival analysis (Catenazzi et al., 2017). Number of tested bacterial morphotypes reported above each data point. (B) Average strength (±SE) of Bd inhibition of anti-Bd isolates (as measured by the relative distance from the streak of the query bacterium to point of 50% of max Bd growth; see Materials and Methods) ranked by inhibitory strength (from strongest to weakest inhibitor) in three Bd-susceptible hosts (in red), three non-susceptible hosts (in blue), and three hosts of unknown Bd susceptibility (i.e., not tested, in gray). Bacterial strains vary by frog host species.
