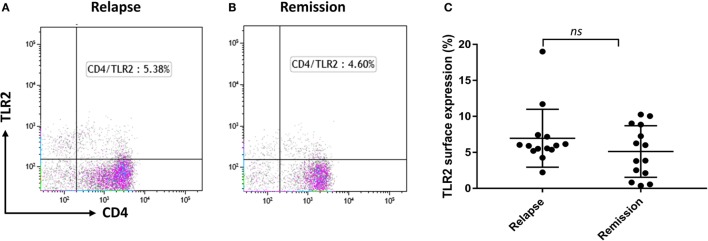
Figure 3.
TLR2 surface expression in relapsing-remitting MS patients and effect of Calpain on TLR2 expression. (A,B) Representative flow cytometry dot plots showing percentage of CD4+ TLR2+ cells for the same patient during relapse and remission. Cells were gated on lymphocytes then live cells and then double gated for CD4 and TLR2. (C) Graphs showing the percentage of CD4+ TLR2+ lymphocytes comparing between relapse and remission in paired samples (n = 14). Data are presented as mean ± SD. Wilcoxon matched-pairs signed rank test gave the P value of 0.1937 showing no significant difference in TLR2 surface expression between relapse and remission.

