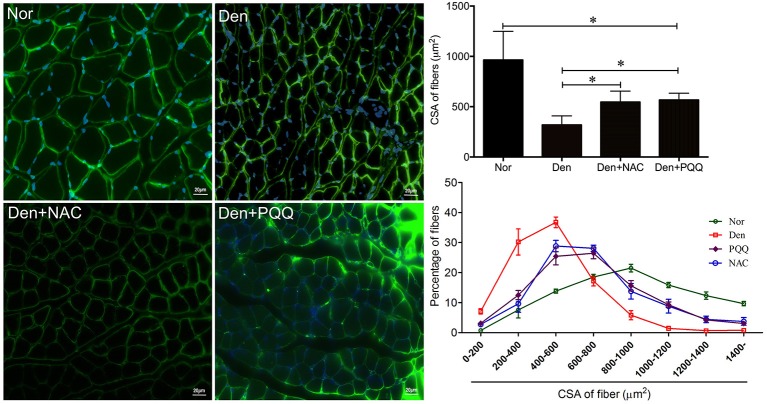
Figure 7.
After mice with denervation-induced soleus muscle atrophy had been injected with saline vehicle or saline vehicle plus NAC (100 mg/Kg) or PQQ (5 mg/kg) for 14 days, the mouse soleus muscle was harvested for determining the fiber CSA. Different muscle samples were harvested from mice receiving sham-operation and further saline treatment (Nor, serving as control), mice receiving sciatic nerve transection and further saline treatment (Den), mice receiving sciatic nerve transection and further saline plus NAC treatment (Den+NAC), and mice receiving sciatic nerve transection and further saline plus PQQ treatment (Den+PQQ), respectively. Histogram (Right) comparing the fiber CSA (upper: absolute value, and lower: distribution frequency) among different muscle samples, where the fiber CSA value is expressed as the mean ± SD from three independent experiments (n = 6). *p < 0.05. Also shown (Left) are representative laminin staining images.

