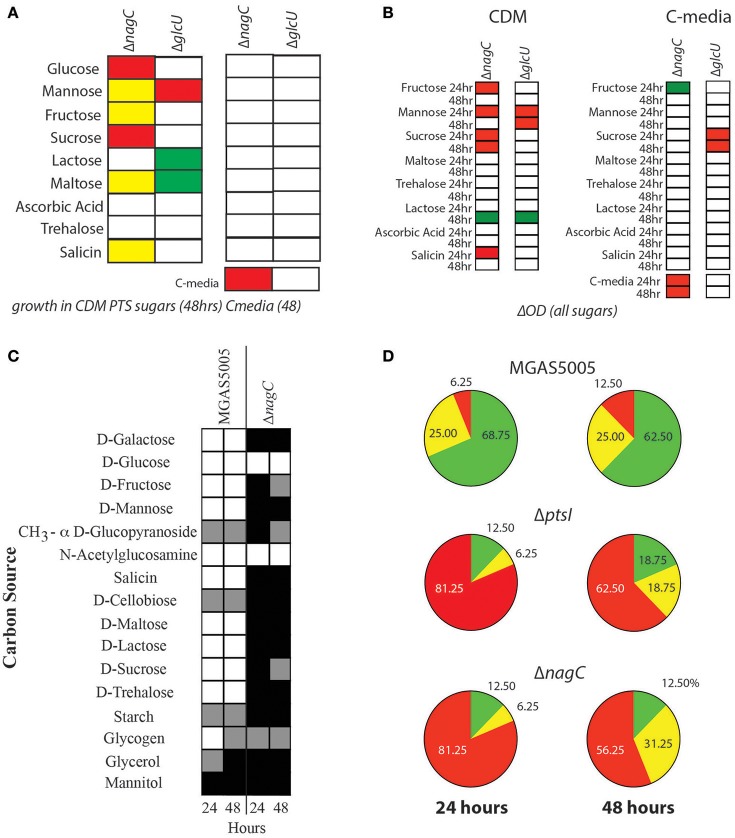
Figure 3.
Deletion of nagC prohibits GAS growth in several PTS sugars. (A) Growth of ΔnagC and ΔglcU mutants was compared to WT MGAS5005 either in CDM + 1% PTS sugar or 0.5% glucose (left) or in C media (0.05% glucose) plus PTS sugar as described in section Materials and Methods. Growth above WT (green), 2-fold below WT (yellow), 2-fold below WT (red), and similar to WT (white) are indicated. (B) Growth yield (ΔOD600) of mutants was calculated after 24 and 48 h of growth in CDM or C-media + 1% PTS sugar. Yield similar to WT (white), lower than WT (red) or higher than WT (green) are indicated. (C) Carbohydrate utilization profile of the ΔnagC mutant was determined by the API®50CH system as described in section Materials and Methods. Positive utilization (+, white), partial utilization (±, gray), and no utilization (−, black) are shown. Readings for each strain are given for 24 h (left) and 48 h (right) are presented. (D) Patterns of carbohydrate utilization from (C) were analyzed by determining the % carbon sources listed that fall into each utilization category. Pie charts show the patterns for WT MGAS5005, ΔptsI, and ΔnagC GAS strains at 24 and 48 h. No utilization (Red), Partial utilization (Yellow), and utilization (green) are depicted with corresponding percentages indicated.

