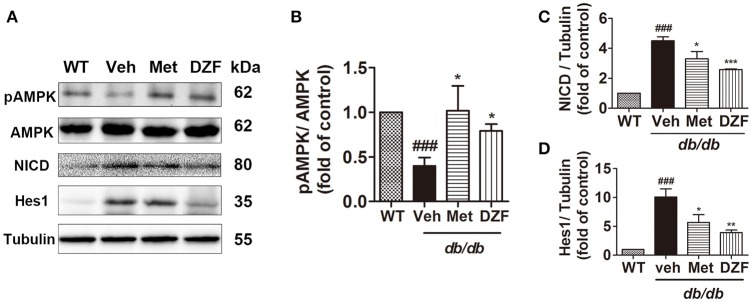
Figure 6.
Representative immunoblots and relative expressions of AMPK and Notch signaling proteins in the liver of wild-type and vehicle-, metformin-, and DZF- (1 g·kg−1) treated db/db mice. (A) Representative immunoblots of pAMPK, AMPK, NICD, Hes1, and tubulin in liver. (B–D) Relative expressions of pAMPK, NICD, and Hes1 in the liver. Data are described as mean ± SD (n = 3). ###p < 0.001 vs. WT control; *p < 0.05, **p < 0.01 and ***p < 0.001 vs. db/db+ vehicle.

