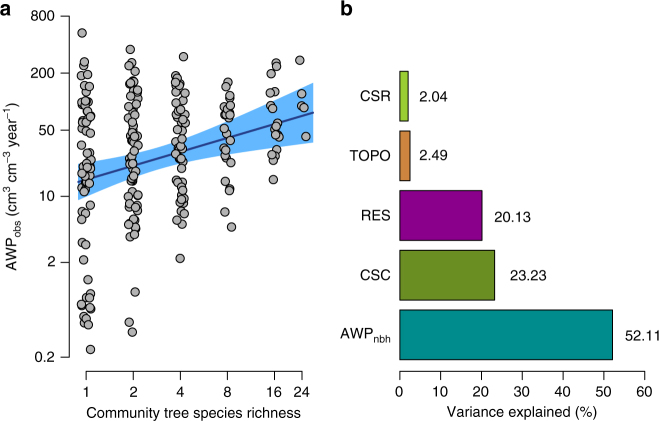
Fig. 2.
Biodiversity effects on community productivity. a Biodiversity–productivity relationship at the community scale. The solid blue line corresponds to the fitted relationship of a mixed-effects model, with the shaded area representing the 95% confidence interval of the prediction. Points represent observed values of standardised aboveground wood productivity (AWPobs) for each individual plot (n = 234; site B). Plot-specific values are jittered to facilitate visibility, and axes are logarithmic. b Biotic and abiotic drivers of the community biodiversity–productivity relationship. Variance partitioning for four predictors: community (i.e., at the plot level) tree species richness (CSR) and composition (CSC, specified as random effect), community productivity based on neighbourhood inteactions (AWPnbh) and heterogeneity in topography (i.e., variation in elevation, TOPO). Bars and numbers next to the bars correspond to the fraction of variance explained by each predictor of a linear mixed-effects model, and the variance not explained by the model (the residual, RES)

