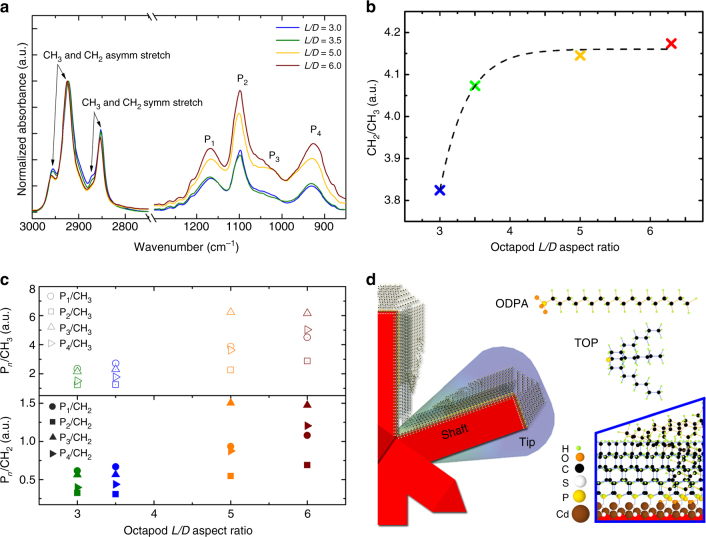
Fig. 3.
Surface characterization of octapods with different aspect ratio. a FTIR spectra collected from the selected octapods; Pn=1…4 indicates the peaks related to P–O(H) and P = O stretching modes of the ligands, mainly the P = O moiety from TOPO and PO32− from phosphonic acids. b CH2/CH3 asymmetric stretching peak ratio for different L/D proving an increase in the amount of long-tailed ODPA on longer shafts, until the signal covers that of the short ligands, coming from the shaft portion near the core. c Pn/CH2 and Pn/CH3 ratios for the studied octapods. Both plots show an increase of the Pn=1…4 compared to the CH2 and CH3 asymmetric stretching modes. d Sketch of an octapod pod showing a cone-like ligand distribution predicted from FTIR analysis: short ligand molecules (TOP) wrap the regions near the core, while long ones (ODPA) are preferentially bound toward the tips when increasing octapod aspect ratio. HPA is also present on the shafts of the pods, but there is no evidence of preferential attachment

