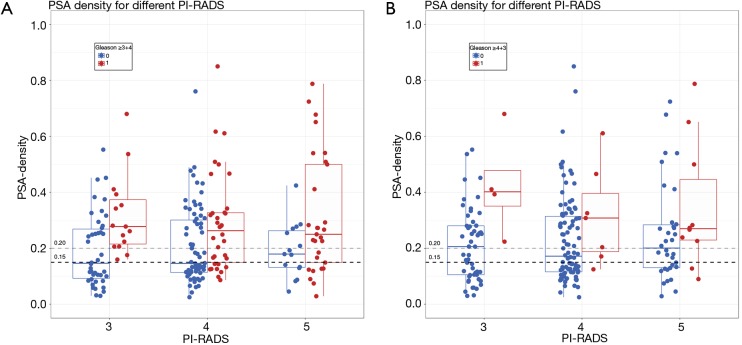
Figure 5.
Dot-plots (and integrated box-plots) of men included in active surveillance. The PI-RADS assessment category 3, 4, and 5 (x-axis) are plotted against the PSA-density (y-axis). The outcome measure is Gleason score (GS), which is dichotomized using cut-off score GS ≥3+4 (A), and GS ≥4+3 (B) for clinically significant prostate cancer. Zero [0] indicated a Gleason score below the cut-off (blue dots and boxplots), and a one [1] indicated a Gleason score above the cut-off score (red dots and boxplots). PI-RADS, MRI suspicion score; PSA, prostate specific antigen.

