
Figure 4.
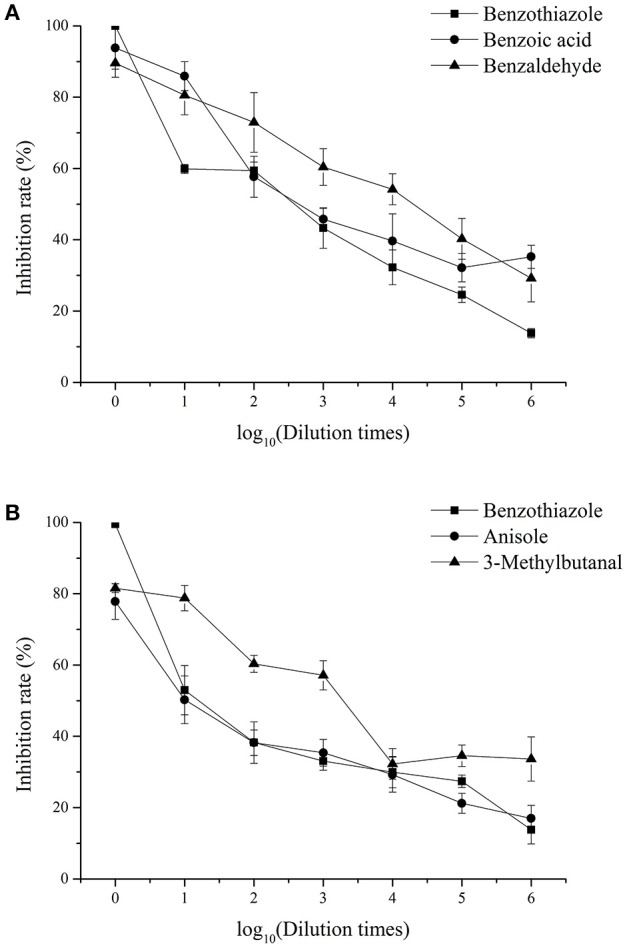
Inhibitory effects of single identified VOCs on M. fructicola (A) and C. gloeosporioides (B) after different dilution times in vitro. Each spot represents the mean value from three independent experiments, and the vertical bars represent the standard errors of the means for each treatment.