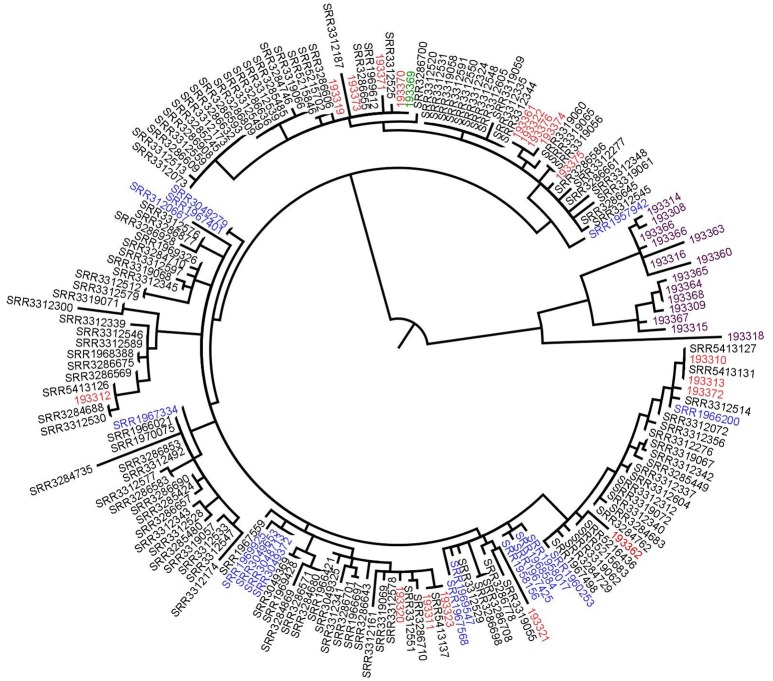
Figure 3.
Phylogenetic tree based on SNPs differences from S. Enteritidis sequences shared by the authors. Blue: previous UK cases isolates, red: Spanish isolates, black: UK patients' isolates, purple: supplementary data provided by the authors (not linked to the outbreak) and green: the food isolate. Tree was generated with Garli and drawn with Figtree.

