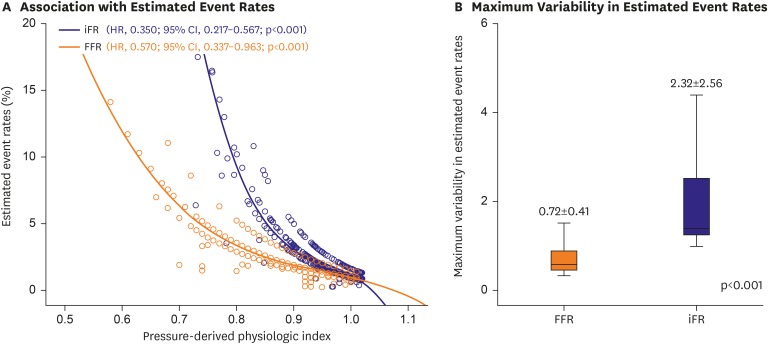
Figure 3.
Association of FFR and iFR with clinical outcomes and the variability in estimated event rates due to intrinsic measurement variability. (A) Both FFR and iFR showed significant association with the estimated 2-year event rates. (B) FFR and iFR showed differences in the variability of the estimated event rates according to the approximate measurement variability. FFR showed lower maximum variability compared with that of iFR. This figure was modified from the original version.25)
CI = confidence interval; FFR = fractional flow reserve; HR = hazard ratio; iFR = instantaneous wave-free ratio.

