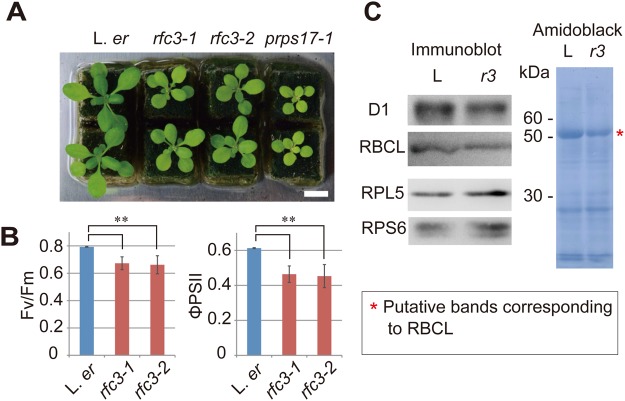
Fig. 2.
RFC3 function in chloroplasts. (A) Shoots from different alleles of rfc3 and prps17-1 mutant plants. Scale bar: 1 cm. (B) The photosynthetic parameters of L. er and two rfc3 alleles [Fv/Fm and (Fm′−Fs)/Fm′=ΦPSII]. The maximum fluorescence level at the closed PSII center (Fm′) and the steady-state fluorescence level (Fs) were determined in actinic light (120 µmol photons m–2 s–1). (C) Immunoblot analysis and Amido Black staining of proteins extracted from L. er (shown as ‘L’) and rfc3-2 (shown as ‘r3’) shoots. Statistical analyses in B were carried out using the paired Student's t-test (**P<0.01).

