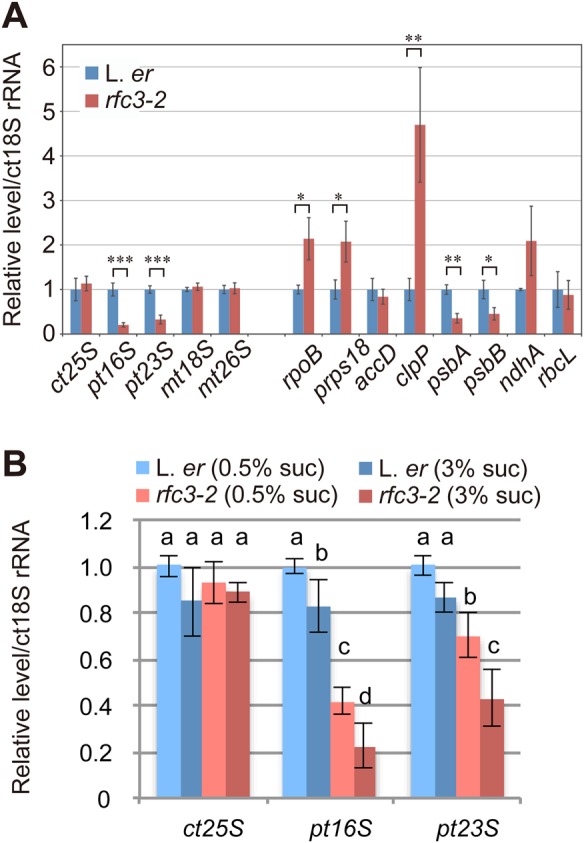
Fig. 3.

Expression of plastid encoded genes in L. er and rfc3-2 roots. (A) Relative RNA levels in roots estimated by RT-qPCR analysis. Plants were grown in media containing 3% sucrose. (B) Effects of sucrose on the levels of plastid 16S (pt16S) and pt23S rRNAs in wild-type and rfc3-2 roots grown in media containing 0.5% or 3% sucrose. Data are mean±s.d. (n=3). Statistical analyses in A were carried out using the paired Student's t-test (*P<0.05, **P<0.01, ***P<0.001); those in B were carried out using two-way ANOVA with Tukey HSD test (P<0.05). Data that are not significantly different are labelled by the same letter. In A and B, ct25S, mt18S and mt28S indicate cytosolic 25S rRNA and mitochondrial 18S and 28S rRNAs.
